Microplastic monitoring for municipal wastewater treatment plants
From 10,000 population equivalents, the EU Urban Wastewater Treatment Directive requires monitoring of microplastics at the inlet and outlet of your plant. We handle all of it: on-site sampling, laboratory detection, reporting. You provide access and power; we bring the rest.
This page gives figures rather than adjectives. Every performance statement links to the publication it comes from.
Last reviewed: August 2026 | Next review: Dezember 2026
What does the EU Urban Wastewater Treatment Directive require of your plant?
Directive (EU) 2024/3019 entered into force on 1 January 2025 and must be transposed into national law by 31 July 2027. It replaces the 1991 Directive 91/271/EEC and introduces a monitoring obligation for microplastics for the first time.
- From 10,000 p.e.: competent authorities monitor the presence of microplastics at the inlet and the outlet of the treatment plant. Each time sampling is carried out, a sample is taken at both points.
- From 10,000 p.e., sludge: microplastics in sewage sludge are to be monitored where relevant — in particular where the sludge is reused in agriculture.
- Storm water overflows and urban runoff from separate systems: microplastics and relevant pollutants are to be captured representatively here too.
Two things that often get missed. First, there is as yet no limit value for microplastics — the directive requires measuring, not complying with a threshold. Second, the measurement methodology is not yet fixed; the Commission will establish it through implementing acts, expected by July 2027.
What that means in practice: anyone waiting for the binding methodology will start without comparative data. Anyone starting now with a standardised procedure will have a time series by then — and with a parameter that fluctuates as strongly as this one, the time series is what matters. The next section explains why.
*The specific sampling frequencies follow from Article 21 and the annex to the directive. What will bind you is the national transposition. The official text is here.*
How much microplastic does a municipal treatment plant actually release?
In the effluent of the Landau-Mörlheim plant in Germany we measured a mean of 27.8 ± 29.8 microplastic particles per litre over two years and three months — with a range from 0.6 to 194.0 particles per litre (Sturm et al., Microplastics 2024, 3, 492). Extrapolated, that is roughly 1.5 × 10¹¹ particles per year from a single plant, about 2.8 million particles per inhabitant per year.
The standard deviation here exceeds half the mean. That is not measurement error but a property of the parameter: contamination varies substantially over time without being explicable by season, weather or other wastewater parameters. The study rests on 320 individual samples.
Treatment plants remove the large majority of incoming microplastics. Because of the volumes involved they nonetheless remain a relevant pathway into surface waters — and through them into the sea. What that looks like in rivers we measured in three German rivers: 4 to 1,761 particles per litre, depending on the water body and the moment of sampling.
Is a fourth treatment stage enough to remove microplastics?
On our comparative measurements, no. We examined the effluents of three municipal treatment plants with different treatment concepts, over extended periods and with identical methodology (Sturm et al., Water 2025, 17, 711):
|
Treatment concept |
Mean microplastic concentration in the effluent |
|
Conventional, three treatment stages |
21.8 MP/L |
|
Four stages with powdered activated carbon |
15.1 MP/L |
|
Two stages with membrane bioreactor (MBR) |
15.1 MP/L |
There was no significant difference between the three plants. Neither the powdered activated carbon nor the membrane bioreactor removed microplastics reliably as a side effect.
We say this although it is inconvenient for us. A fourth treatment stage is highly effective against dissolved trace substances and is, for good reason, at the heart of the new directive. For microplastics, our data show it does not follow automatically. If someone is selling you a fourth-stage upgrade as the solution for microplastics, it is worth asking for the measurement data. More on this, and on the limits of our own claims, on our Sustainability page.
For practical purposes: measuring and removing are two separate decisions. The monitoring obligation from 10,000 p.e. applies whether or not you upgrade. And without measured values the benefit of an upgrade cannot be quantified at all.
How many samples do you need for a reliable result?
For a ± 25 % margin of error at 95 % confidence you need 21 large-volume filtration samples or 51 grab samples (Sturm et al., Microplastics 2026, 5, 75). This is the question that precedes every tender, and it is rarely answered.
We compared four water matrices for this, including treatment plant effluent and combined sewer overflow. Large-volume filtration through our particle sampling unit (100 L, 10 µm) achieved a mean relative standard deviation of 41 ± 17 %; conventional grab sampling (0.5 L) reached 64 ± 19 %. Recovery using polyamide reference particles (357 ± 60 µm) was 93 ± 7 % for grab samples and 88 ± 23 % for large-volume filtration.
In the river study, large-volume filtration returned concentrations 4.7 times higher than grab sampling. Monitoring based on grab samples systematically underestimates contamination — and risks producing figures that a later official measurement cannot reproduce.
So we plan campaigns by target precision rather than by habit. Tell us the margin of error you need and we will tell you how many samples that costs.
What Wasser 3.0 takes on
From booking to report — you need to prepare nothing beyond access, power and tap water.
1. Standardised on-site sampling
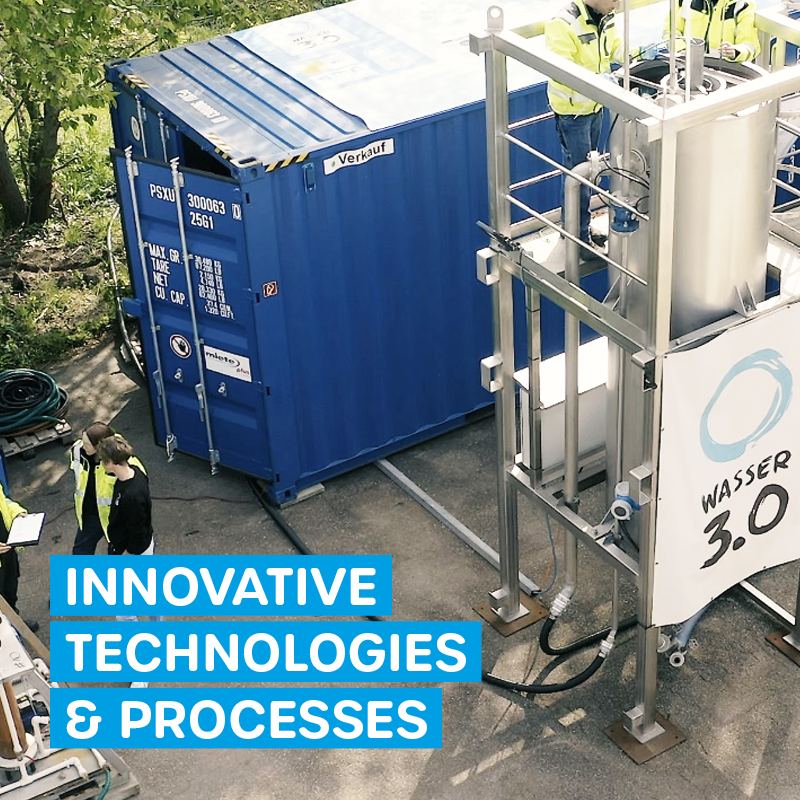
We bring our particle sampling unit, a mobile system for sampling large volumes. It filters on site at 10 µm and makes sample volumes accessible that grab sampling cannot reach. Sampling follows the same protocol as in our publications — the precondition for your values being comparable with other plants and with your own previous years. Technical detail under Microplastic Analytics.
2. Laboratory detection
Samples are digested oxidatively, stained with purpose-developed Nile red derivatives and counted automatically under a fluorescence microscope. The method was developed, optimised and published in Anal. Bioanal. Chem. 2021, 413, 1059, Analytica 2023, 4, 27 and Microplastics 2023, 2, 334.
3. Reporting
You receive concentrations in microplastic particles per litre (MP/L), with the number of samples, the variance and the methodology stated — in a form that stands up before regulators and committees.
Want to sample yourself?
We provide our manuals for standardised microplastic analytics for sampling and sample preparation. The microscope modification needed for fluorescence evaluation can be built from materials costing under EUR 30 (Analytica 2023, 4, 27).
How reliable is the method?
Recovery rates range from 93.3 % for polypropylene to 101.7 % for polyester.
The method has been applied at a municipal treatment plant across 320 samples and two years and three months (Microplastics 2024, 3, 492), and in the comparison of three plants with two, three and four treatment stages (Water 2025, 17, 711). Contamination control runs throughout.
Equally important: the choice of dye and evaluation method changes the result. At the same site and over the same period, values came out as 41, 87 or 103 MP/L depending on the variant used (Analytica 2023, 4, 27).
We use only one fluorescent marker in our standard protocol and document the methodology in the report. A numerical value without the associated method is not comparable.
What you provide on site
- Access to the treatment plant
- Power supply
- Access to the outlet manhole or outlet (and, for the inlet monitoring required by the directive, to the inlet)
- Access to tap water
Nothing else is needed. Sampling times are arranged flexibly around your operations.
And if you want to remove microplastics, not just measure them?
Then measurement is the first step, not the last. Without baseline values no removal performance can be demonstrated and no upgrade justified.
Our removal technology, Wasser 3.0 PE-X®, is based on agglomeration and fixation using organosilanes and works without filters. At the municipal treatment plant on Mykonos, a pilot unit downstream of a two-stage activated sludge line removed 86 ± 8 % of microplastics, while reducing total suspended solids by 95 ± 3 % (Sturm et al., Clean Technol. 2026, 8, 32). Influent concentrations there ranged from 633 to 5,843 MP/L, effluent values from 96 to 263 MP/L.
In heavily loaded industrial wastewater the figures are higher — up to 97.4 % by mass and 99.1 % by particle count (Clean Technol. 2025, 7, 67). That range is systematic: removal rates fall at lower starting concentrations and in more complex matrices. We publish both so that you can plan with realistic expectations.
What happens to the separated material is described under Reuse & Circularity — including the finding that the agglomerates are, on current analysis, not suitable for landfill and today go mostly to thermal recovery. The technology overview gives the whole picture.
A note on indirect dischargers
A substantial share of the microplastic load reaching municipal plants comes from industrial discharges. Removal at source is far more effective than removal at the end of the chain: at a plastics processing company, a pilot plant kept a calculated 1.7 t of microplastics and 6 t of COD per year out of the sewer system altogether (Clean Technol. 2025, 7, 67). If you have indirect dischargers in your catchment, our offers for industry are worth a look.
Where our claims stop
- Tyre wear particles are not detectable with our current standard.
- There is as yet no binding EU measurement methodology for microplastics in urban wastewater. Our method is published and reproducible, but it is not yet a standard.
- Removal performance was measured at individual plants and water matrices and cannot simply be transferred.
- Statements on the legal position reflect our knowledge at the date given and do not replace legal advice. What binds you is the national transposition of the directive.
All studies are available in full under Publications. Details on structure and use of funds under Transparency.
Next step
Tell us your plant size, the margin of error you need and the period — we will calculate the number of samples and send a quote.
FAQ
Further information