Removing microplastics from industrial process water and wastewater
Across three published pilot studies on real industrial wastewater, Wasser 3.0 PE-X® removed between 97.4 % and 98.3 % of microplastics by mass — while reducing COD by between 78.8 % and 96 %. The range is not vagueness; it reflects different water matrices and plant configurations.
This page gives figures with their measurement conditions and their source. It also states what the process costs, what residue it produces, and where our claims stop.
Last reviewed: August 2026 · Next review: December 2026
Why now? Three EU acts that affect your water processes
Plastic pellets: the pellet regulation has applied since December 2025
Regulation (EU) 2025/2365 on preventing plastic pellet losses entered into force on 16 December 2025 and applies directly, with no national transposition. It covers economic operators that handled at least 5 t of pellets in the previous calendar year, and carriers.
Already applicable are the duty to prevent losses, immediate action where losses occur, staff training, and annual documentation of estimated loss quantities. From 17 December 2027, risk management plans and notification duties are added; from 1,500 t handled per year, a certification requirement.
What our technology contributes — and what it does not. The regulation addresses handling, packaging, transport and operational organisation across the whole supply chain. We cover one pathway: discharge via process water and wastewater. Our microplastic analytics produce measurement data on that pathway which can feed into the required documentation. A wastewater treatment does not deliver compliance with the regulation. Anyone promising you that is selling you too much.
Urban wastewater: from 2027, your load becomes visible
Directive (EU) 2024/3019 entered into force on 1 January 2025 and must be transposed into national law by 31 July 2027. Article 21 requires competent authorities to monitor microplastics at the inlet and outlet of municipal treatment plants from 10,000 population equivalents.
For indirect dischargers, the inlet measurement is the decisive point: it makes industrial loads systematically visible, both to the plant operator and to regulators. What that means on the municipal side is set out under offers for wastewater treatment plants.
A common misconception: the directive sets no limit value for microplastics. It requires measuring, not complying with a threshold. The extended producer responsibility with at least 80 % cost contribution to quaternary treatment applies to producers of human and veterinary medicinal products and cosmetics — not across all industry.
REACH: what the microplastic restriction does not cover
Regulation (EU) 2023/2055 restricts intentionally added synthetic polymer microparticles in products from 0.01 % by weight. It does not cover unintentional release from production processes into wastewater. We say so because the two acts are regularly confused — including in competitors' proposals.
What the process actually achieves in industrial wastewater
Three pilot plants, three water matrices, three published datasets.
|
Application |
Microplastic removal |
Further measured values and source |
|
Packaging production — automated pilot plant, 25 continuous test runs. Raw wastewater: 1,725 ± 377 mg/L microplastics, 673 ± 183 million particles/L, COD 7,570 ± 1,339 mg/L |
97.4 % (by mass) · 99.1 % (by particle count) |
COD −78.8 %. Extrapolated: 1.7 t of microplastics and 6 t of COD per year kept out of the sewer system · Korzin et al., Clean Technol. 2025, 7, 67 |
|
Plastics processing — 8 test phases over 3 months, 1 m³ and four treatments each, 12 samples per phase |
98.26 ± 2.15 % (by mass) · 97.92 ± 2.31 % (by particle count) |
COD −94.3 ± 8.9 %; 1.1 kg of microplastics avoided per m³, around 2.7 t per year · Sturm et al., Water 2024, 16, 268 |
|
Plastics processing — pilot plant with belt filter and activated carbon stage |
98.0 ± 1.1 % (by mass) · 99.9987 ± 0.0007 % (by particle count) |
COD −96 ± 2.7 %; turbidity −99.6 ± 0.1 % · Puhar et al., Water 2025, 17, 671 |
Why the values differ. The effectiveness of agglomeration-fixation depends on polymer type, water composition and temperature — which we investigated systematically in Water 2021, 13, 675. That is why every project starts with a feasibility study using your water, not with a percentage from a brochure.
For scale, so you can place these figures: in the effluent of a two-stage municipal plant on Mykonos, removal was 86 ± 8 % (Clean Technol. 2026, 8, 32). At lower starting concentrations and in more complex matrices the rate falls systematically. Heavily loaded industrial wastewater is the favourable case for this process.
What it costs in consumables
Measured consumption figures, so you can weigh effort against benefit:
|
Metric |
Packaging production |
Plastics processing |
|
Electricity per m³ of treated wastewater |
1.4 kWh |
0.8 kWh |
|
Reagent per m³ |
0.7 L (abcr eco Wasser 3.0 PE-X®, industrial wastewater) |
1.00 mL |
|
Source |
The two reagent figures differ by orders of magnitude because they refer to different formulations and water matrices. We therefore present them side by side rather than averaging them. Which value applies to your process is what the feasibility study establishes.
What we are deliberately not claiming is that this process is more energy-efficient than other removal technologies. There is as yet no robust life-cycle assessment comparison with filtration or other microplastic removal processes — this remains an open question for research.
What the life cycle assessment shows — and what it does not
The life cycle assessment was carried out in collaboration with the University of Maribor using the CML method (openLCA, Ecoinvent 3.9), with the functional unit being one cubic metre of treated wastewater (Puhar et al., Water 2025, 17, 671).
The main drivers for the pilot trials are identified as: the consumption of filter fleece (36.7 km per year in batch operation) and the incineration of the separated agglomerates. In a modelled circular economy scenario — using an endless belt filter instead of filter fleece, and material recovery instead of incineration — the global warming potential is calculated to fall to 1.0 kg CO₂ equivalents per m³, i.e. by around 96 per cent. Across all impact categories, 10 out of 11 decrease by between 78 and 97 per cent.
And the eleventh: the eutrophication potential increases in the optimised scenario. This is due to the continuous belt filter’s 15 per cent higher electricity demand within the German electricity mix and the loss of the energy recovery credit from incineration. Compared with the untreated baseline, both variants perform significantly better; in a direct comparison with one another, however, there is a conflict of objectives.
What the 96 per cent figure does not represent: it is not a reduction target achieved, nor a statement of climate neutrality, nor does it relate to offsetting. It is a comparison of two plant concepts, and the circular economy scenario is, as yet, a model assumption, not actual operation. The full presentation, including system boundaries and assumptions, can be found under Sustainability.
Water reuse: what is evidenced and what is assumed
Treated process water can be returned to the production cycle. The percentages in circulation are estimates, however, and we label them as such.
- Up to 80 % water saving at the packaging production site — based on an estimated fourfold reuse of the treated process water (Korzin et al. 2025). Not an operating value gathered over time.
- 9 m³ of reusable water per m³ of treated wastewater — a modelling assumption in the life cycle assessment (Puhar et al. 2025), not a measurement across multiple sites.
Reuse becomes possible because COD falls substantially alongside microplastics, and process chemicals such as surfactants remain in the water. What reuse rate your process permits depends on your quality requirements and is established in the feasibility study — not promised in advance.
What comes out of the process: the agglomerates
The process removes microplastics from water and produces a residue in doing so. That belongs in an honest calculation.
At the packaging production site, around 1.9 t of dried agglomerates per year were produced (5.976 t wet, 4.423 t pressed); at a second site the calculated figure is 9.1 t of dry mass per year.
Analysis in accordance with landfill legislation showed that these agglomerates are not suitable for landfill, but reuse is possible (Korzin et al., Clean Technol. 2025, 7, 67).
Our aim is material recovery, and we develop a reuse concept for every application. In the life cycle assessment, use as concrete filler is already calculated as a scenario. No operating data exist for it yet.
For your calculation this means: budget for disposal of the residue. We quantify it in the feasibility study rather than leaving it out.
Measure before you remove
Without a baseline measurement no removal performance can be demonstrated — and no investment justified. Our microplastic analytics use fluorescent staining with purpose-developed fluorescence dyes and automated counting. Recovery rates range from 93.3 % for polypropylene to 101.7 % for polyester (Microplastics 2023, 2, 334), with around 45 minutes of working time per sample (Analytica 2023, 4, 27).
How many samples you need depends on the precision you want: for a ± 25 % margin of error at 95 % confidence, 21 large-volume samples or 51 grab samples (Microplastics 2026, 5, 75). Single samples are not representative.
Our technology and plant engineering
Wasser 3.0 PE-X® is based on agglomeration and fixation using hybrid silica gels — clump & skim. Microplastic particles are clumped into separable aggregates and removed through coarse-pored separation units. The process works without membranes and without high pressure. The whole detect–remove–reuse approach is described in the technology overview.
Modular and scalable
- Integration into existing processes as a standalone solution or add-on
- Adaptable to different types and concentrations of contamination
- Scalable from laboratory through pilot plant to full-stream operation
- Modular design for step-by-step implementation
Rental plants for preliminary trials
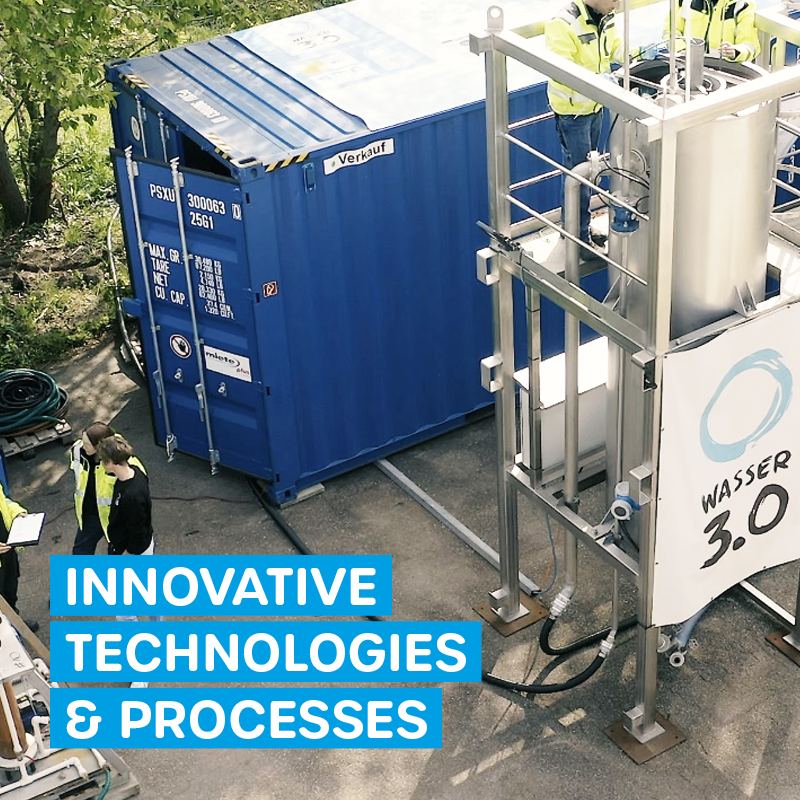
- Containerised, batch or continuous operation
- Reactor vessel for microplastic removal: 250 L
- Additional module for COD removal: 250 L
- Belt filter as the separation unit
- Dosing and contact times matched to your process
- Minimum on-site rental period: one month
Your path to a project
- Initial contact. Known process parameters, via our checklist.
- Initial meeting. Question, requirement profile, first outline of a solution.
- Data collection and process analysis with initial preliminary trials.
- Development in the laboratory and pilot hall. Tailored material composition on a modular principle, prototype construction.
- Pilot hall trials in batch or semi-continuous operation.
- On-site rental plant. Process integration and long-term operation in partial or full stream, minimum one month.
- Data evaluation and benefit analysis. All measurement data evaluated and the economic and ecological effects quantified for your case.
- Scale-up and full operation.
What you can expect from a feasibility study

A feasibility study answers, for your specific process:
- Technical feasibility — does the process work with your water matrix, and at what removal rate
- Economic viability — investment, consumables, disposal of the residue, potential savings from water reuse
- Ecological effects — quantified for your case, using the same system boundaries as our published life cycle assessment
- Legal framework — which of the acts named above apply to you
- Resource requirements and stakeholders — what the project takes in funds and involvement.
We do not promise savings in advance. Whatever the study finds, it finds — including the finding that an upgrade does not pay off for you.
Why Wasser 3.0
- Published data instead of brochure figures. Every performance statement on this page comes from peer-reviewed open-access publications and is linked here. The full list is under Publications.
- Non-profit company. Under our articles of association we are not structured for profit distribution; charitable status is determined by the competent German tax office. Details on structure and use of funds under Transparency and Company.
- Interdisciplinary team from chemistry, process engineering and environmental science, with research collaborations including the University of Maribor and the National Technical University of Athens.
- We name the limits too. We cannot measure tyre wear, the residue is not suitable for landfill, and no comparative life cycle assessment against alternative processes exists. That is on this page, not in the small print.
A note on the UN Sustainable Development Goals
We map our work to the UN Sustainable Development Goals as a reference framework, not as a label. The SDGs are not a certification scheme and not third-party verification. The specific substantiated contributions we map are set out on our sustainability page with sources
Next step
- Download the process parameter checklist and fill it in.
- Send us the completed document.
- Once we have reviewed it, we will get in touch for a non-binding initial meeting.
Or go straight there: request a quote.
FAQ
Further information