
Sustainability at Wasser 3.0: What we contribute, what we measure, what we don't know
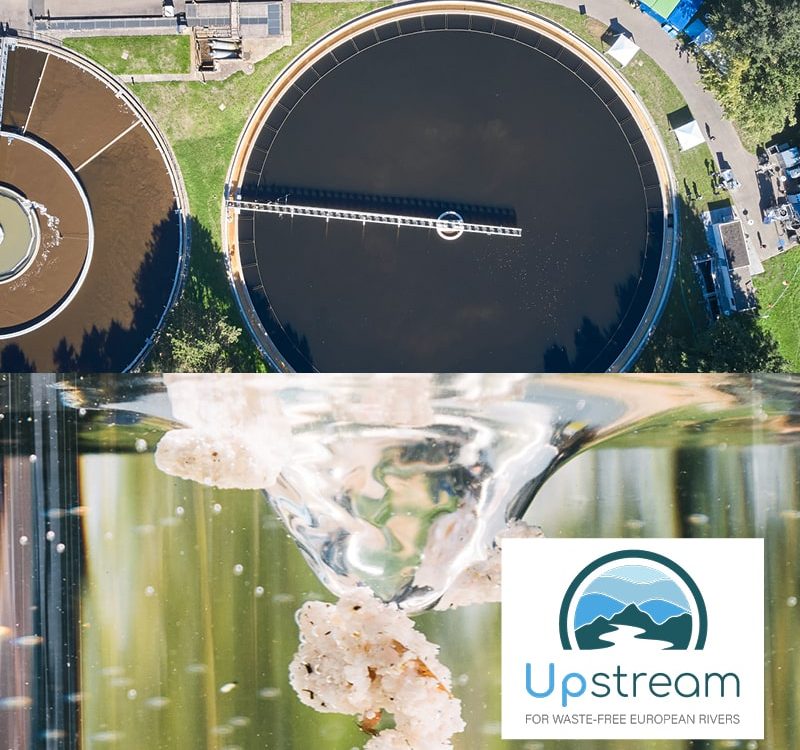
Wasser 3.0 is a non-profit company based in Karlsruhe, Germany, that develops methods to detect, remove and reuse microplastics from water. Across pilot installations at four sites in Germany and Greece, between 86 % and 99.1 % of microplastics were removed from the treated water — depending on water matrix, plant configuration and the quantity measured. Every figure on this page links directly to the publication it comes from.
This page is deliberately plain. We give measured values together with the conditions they were measured under, we separate measured results from modelled ones, and we state where our claims stop.
Last reviewed: August 2026 | Next review: December 2026
What does Wasser 3.0 actually do?
Wasser 3.0 develops two things: a process that removes microplastics from water, and a process that makes microplastics in water visible and countable.
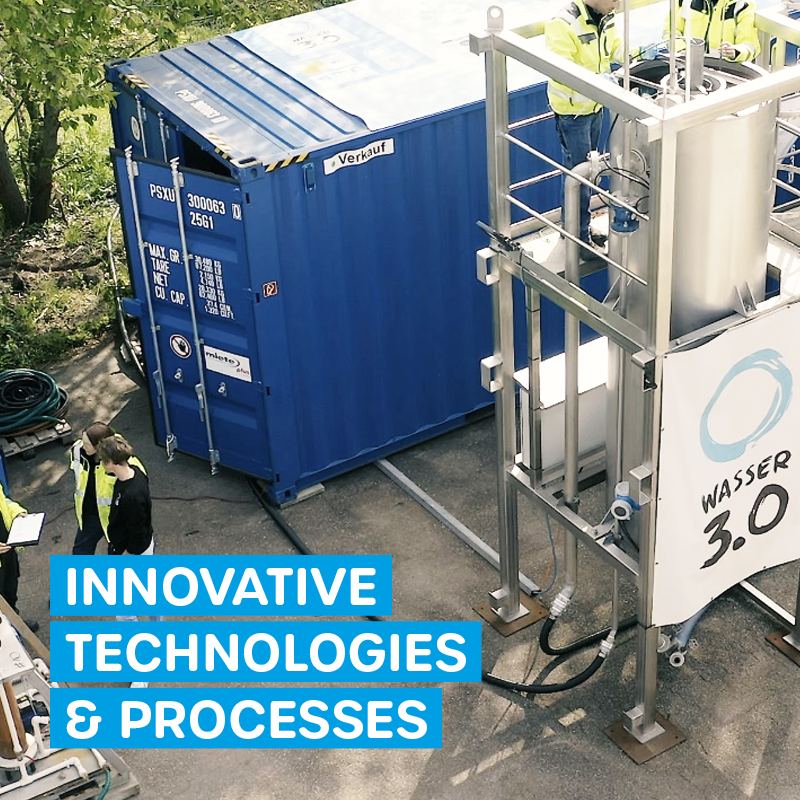
Microplastic removal is based on agglomeration and fixation using organosilanes, marketed as Wasser 3.0 PE-X®. The reagents bind microplastic particles into clumps that are skimmed off mechanically or separated on a belt filter. How strong the effect is depends on polymer type, water composition and temperature — which we investigated systematically in Water 2021, 13, 675. The process requires neither membranes nor high pressure. We call this "low-tech" in the sense of low plant complexity and low maintenance — not as an environmental claim.
Microplastic analytics is based on fluorescent staining with purpose-developed Nile red derivatives (Anal. Bioanal. Chem. 2021, 413, 1059) and automated particle counting under a fluorescence microscope. The method is faster and cheaper than spectroscopic techniques, which is what makes the high sample numbers affordable that reliable monitoring requires.
All of this work is documented in full in our publications overview. As a gGmbH — a non-profit limited company under German law — we are not structured for profit distribution; charitable status is determined by the competent German tax office. Details on use of funds and structure are under Transparency and Company.
How are the claims on this page substantiated?
Every performance figure on this page links to a freely accessible publication and carries one of three status labels.
- Measured — results from our own trials, stating the plant, water matrix, number of samples and period.
- Modelled — results from life cycle assessment or extrapolation, stating system boundaries and assumptions.
- Target — intentions for which no evidence yet exists.
What we don't do: offset-based climate claims, company-wide environmental claims derived from individual results, or self-issued labels without independent certification.
How much microplastic do Wasser 3.0 processes remove?
Between 86 % and 99.1 %, measured across four pilot sites with different water matrices. The range is not imprecision — it is the finding. Removal performance depends on polymer type, water composition and initial load. A single percentage covering every application would be misleading.
|
Site and water type |
Microplastic removal |
Further measured values and source |
|
Packaging production, Germany — automated pilot plant, 25 continuous test runs |
97.4 % (by mass) · 99.1 % (by particle count) |
COD −78.8 %; raw wastewater 1,725 ± 377 mg/L and 673 ± 183 million particles/L · Korzin et al., Clean Technol. 2025, 7, 67 |
|
Plastics processing, Germany — 8 test phases over 3 months, 1 m³ each |
98.26 ± 2.15 % (by mass) · 97.92 ± 2.31 % (by particle count) |
COD −94.3 ± 8.9 %; 1.1 kg of microplastics avoided per m³ · Sturm et al., Water 2024, 16, 268 |
|
Plastics processing, Germany — pilot plant with belt filter and activated carbon stage |
98.0 ± 1.1 % (by mass) · 99.9987 ± 0.0007 % (by particle count) |
COD −96 ± 2.7 %; turbidity −99.6 ± 0.1 % · Puhar et al., Water 2025, 17, 671 |
|
Mykonos WWTP, Greece — municipal wastewater after two-stage activated sludge, 5 experimental loops |
86 ± 8 % |
Influent 633–5,843 MP/L, effluent 96–263 MP/L; TSS −95 ± 3 %; turbidity −93 ± 7 %; COD −70 ± 20 % · Sturm et al., Clean Technol. 2026, 8, 32 |
What these figures do not mean: they cannot be transferred to arbitrary wastewaters. The gap between 99.1 % in heavily loaded industrial wastewater and 86 % in the municipal effluent at Mykonos is systematic — removal rates fall at lower starting concentrations and in more complex matrices. We publish both values, not only the higher one. Which configuration suits which case is described separately for municipal treatment plants and for industrial applications.
How much microplastic does a municipal treatment plant release?
In the effluent of the Landau-Mörlheim WWTP in Germany we measured a mean of 27.8 ± 29.8 microplastic particles per litre over two years and three months, ranging from 0.6 to 194.0 particles per litre (Sturm et al., Microplastics 2024, 3, 492). Extrapolated, that is roughly 1.5 × 10¹¹ particles per year from this single plant, equivalent to about 2.8 million particles per inhabitant per year.
The study rests on 320 individual samples taken with a 10 µm filter cartridge. No statistically significant seasonal variation could be demonstrated, and no correlation with other wastewater or weather parameters was found.
Rivers carry substantial loads too. Across three German rivers we measured concentrations between 4 and 1,761 microplastic particles per litre (≥ 10 µm); the Rehbach showed the highest mean (540 ± 476 MP/L), the Alb the lowest (98 ± 54 MP/L) — reported in Microplastics 2025, 4, 63. The scale of variation within a single river is the real result. For those who want to measure themselves, our Global Map of Microplastics collects such data in standardised form.
Does a fourth treatment stage remove microplastics?
On our measurements, not to any significant degree. We compared the effluents of three municipal treatment plants using different treatment concepts, over extended periods and with identical methodology (Sturm et al., Water 2025, 17, 711). The result:
|
Plant type |
Mean microplastic concentration in the effluent |
|
Conventional, three treatment stages |
21.8 MP/L |
|
Four stages including powdered activated carbon |
15.1 MP/L |
|
Two stages with membrane bioreactor (MBR) |
15.1 MP/L |
There was no significant difference in microplastic contamination between the three plants. Neither the fourth stage with powdered activated carbon nor the membrane bioreactor removed microplastics reliably. In all three effluents, contamination also fluctuated strongly over time.
This contradicts a widespread assumption. Advanced wastewater treatment is highly effective against dissolved trace substances and is, for good reason, central to the Urban Wastewater Treatment Directive (EU) 2024/3019, which entered into force on 1 January 2025 and must be transposed into national law by 31 July 2027. On our data, that effectiveness does not extend automatically to microplastics. Presenting plant upgrades as the answer to microplastics promises more than the measurements support. What is needed is a treatment stage designed specifically for microplastic removal — which is what Wasser 3.0 PE-X® was built for.
How does Wasser 3.0 measure microplastics?
Through fluorescent staining rather than spectroscopy — which brings working time down to 45 minutes per sample and makes the high sample numbers affordable that reliable statements require (Sturm et al., Analytica 2023, 4, 27). The microscope modification costs under EUR 30 in materials; counting is automated by script, which improves comparability over manual counting.
Recovery rates for the optimised method range from 93.3 % for polypropylene to 101.7 % for polyester, with total sample preparation and measurement taking 2.5 to 3 hours (Sturm et al., Microplastics 2023, 2, 334). The full service offering is described under Microplastic Analytics.
What the method is currently unable to achieve in a standardised and validated manner is the detection of tyre abrasion — the black colour causes significant fluorescence quenching. Of the three fluoropolymers tested, two were reliably detectable, whilst one was not. This is a genuine shortcoming that we have identified and are currently working to address through research projects.
The choice of evaluation method materially affects the result. At the same site and over the same period, mean effluent concentrations came out as 41, 87 or 103 microplastic particles per litre depending on the dye and counting method used. We publish that range, because a single figure without its method says very little.
How many samples does reliable monitoring require?
For a ± 25 % margin of error at 95 % confidence, you need 21 large-volume filtration samples or 51 grab samples (Sturm et al., Microplastics 2026, 5, 75). Single samples are not representative — the most consistent finding across our monitoring work.
We compared four water matrices: treatment plant effluent, tap water, combined sewer overflow and surface water. Large-volume filtration through a particle sampling unit (100 L, 10 µm) achieved a mean relative standard deviation of 41 ± 17 %, against 64 ± 19 % for grab sampling (0.5 L). Recovery using polyamide reference particles (357 ± 60 µm) was 93 ± 7 % for grab samples and 88 ± 23 % for large-volume filtration.
In the river study, large-volume filtration returned microplastic concentrations 4.7 times higher than grab sampling, with better reproducibility. Monitoring based on grab samples systematically underestimates contamination.
These figures are why we publish monitoring design rather than only monitoring results. Without comparable methodology no limit values can be justified — and without limit values, no regulation. Background material is collected in our knowledge database.
What does the life cycle assessment show?
The pilot plant generates 25.4 kg CO₂ equivalents per cubic metre of treated wastewater. In a modelled circular scenario this falls to 1.0 kg CO₂ equivalents, a reduction of roughly 96 % (Puhar et al., Water 2025, 17, 671). Both values come from a life cycle assessment carried out with the University of Maribor using the CML method (openLCA, Ecoinvent 3.9), with a functional unit of one cubic metre of treated wastewater.
The largest contributors to the current figure are filter fleece consumption (36.7 km per year in batch operation) and incineration of the separated agglomerates. The modelled scenario replaces both: an endless belt filter instead of fleece consumption, and material reuse of the agglomerates as concrete filler instead of incineration. Across impact categories, 10 of 11 then fall by 78 to 97 %.
And the eleventh category: eutrophication potential increases in the optimised scenario. The causes are 15 % higher electricity demand for the endless belt filter within the German electricity mix, and the loss of the energy-recovery credit from incineration. Against the untreated baseline, both variants perform considerably better on eutrophication; compared with each other, this is a trade-off, and we present it as one.
What the 96 % is not: not an achieved reduction, not a claim of climate neutrality, and nothing to do with offsetting. It is a comparison between two plant concepts. The circular scenario using concrete filler is a modelling assumption, not an operating practice.
Measured electricity demand is 0.8 kWh or 1.4 kWh per cubic metre of treated wastewater depending on the plant, and reagent input 1.00 mL or 0.7 L per cubic metre. We publish these so that effort can be weighed against benefit — not as an efficiency claim against other technologies. No robust comparative LCA against alternative removal methods yet exists; that remains an open research question.
What happens to the microplastics that are removed?
It is produced as an agglomerate and is currently mainly sent for thermal recovery. At the packaging production site, around 1.9 t of dry agglomerates are produced annually (5.976 t wet, 4.423 t compressed), whilst at a second site the calculated figure is 9.1 t of dry matter per year.
Analysis in accordance with the Landfill Ordinance (Korzin et al., Clean Technol. 2025, 7, 67) revealed that the products are not suitable for landfill. Current research shows that, in addition to thermal recovery, a new form of material recovery is also possible.
Our aim is to present this qualification in full and have it validated externally. For each application, we develop a recycling concept aimed at the material recycling of the agglomerates — in the life cycle assessment, their use as concrete filler has already been calculated as a scenario. No operational data from continuous operation is available as yet. We state this explicitly because a circular economy promise is meaningless without an ongoing circular process.
How does Wasser 3.0 contribute to the UN Sustainable Development Goals?
A note on the SDG icons
The 17 UN Sustainable Development Goals are a reference framework we use to describe our work — not a label, not a certification, and not third-party verification. Use of the SDG icons follows UN communication guidelines and says nothing about audited sustainability performance at Wasser 3.0.
Substantiated: removal performance of 86 % to 99.1 % across four pilot sites (Korzin 2025, Sturm 2024, Puhar 2025, Sturm 2026), and standardised detection methods whose methodology is published in full and therefore reproducible (Analytica 2023, Microplastics 2026).
Treatment plant effluent and rivers are documented pathways for microplastics into the sea. The Mykonos pilot reduced microplastic concentrations in the effluent from 633–5,843 to 96–263 particles per litre, in immediate proximity to the Mediterranean (Clean Technol. 2026, 8, 32). We make no claim about the effect on global marine pollution — there is no robust basis for one.

Our processes rest on simple process engineering: stirring, dosing, mechanical separation, without membranes or high pressure. The approach intervenes at source inside the industrial plant, before the load reaches the municipal treatment works (Korzin 2025).
At the packaging production pilot site, a calculated 1.7 t of microplastics and 6 t of COD per year are kept out of the sewer system. The treated process water is intended to be returned to the production cycle; at an estimated fourfold reuse this would correspond to saving up to 80 % of process water. That figure is an estimate from this study, not an operating value gathered over time. *(Status: modelled)*
We have calculated the global warming potential of the process (25.4 kg CO₂ eq. per m³ as currently operated) and identified the main drivers: filter fleece consumption, waste incineration and electricity demand (Puhar et al. 2025). We are working on all three. We make no climate neutrality claim and we do not offset emissions.
There are indications that microplastics are relevant to human health; research on dose–response relationships in humans remains incomplete. What is known and what is not is set out under Knowledge: Microplastics. Our contribution lies in reducing inputs and providing reliable measurement data — not in asserting a quantified health effect.

We deliver knowledge on water and microplastics through school and out-of-school formats and public lectures, and publish our research consistently in open access. The rationale is set out in our educational mission. For numbers please check the annual acitivity reports.
Treated water can be reused in industrial processes. The life cycle assessment assumes reuse of 0.9 m³ per m³ of treated wastewater — a modelling assumption, not an operating figure gathered across multiple sites (Puhar et al. 2025). We make no claim regarding the prevention of water scarcity or drought.
We work in research collaborations, including with the National Technical University of Athens (Clean Technol. 2026, Water 2025) and the University of Maribor (Water 2025), in EU-funded projects (Horizon Europe, UPSTREAM, REMEDIES, REMEDIES 5.0, and in the Catalyst 2030 network. An overview is under Partner & Networks. Network membership is not a certification.
UN Water Action Decade 2018–2028
In December 2017 the United Nations adopted General Assembly resolution 71/222, launching the international decade for action on "Water for Sustainable Development" (2018–2028). It aims to concentrate efforts on water scarcity, limited access to clean water and sanitation, and growing pressure on water bodies and ecosystems.
Wasser 3.0 contributes to the aims of the Decade through research, technology development and education. This is an alignment with a UN framework — not an award, an accreditation, or an assessment by the United Nations.
Where our claims stop
- Removal performance was measured at individual plants and water matrices. It cannot simply be transferred to other wastewaters.
- The separated agglomerates are, on current analysis, not suitable for landfill and go to thermal recovery. Material recovery is a target, not current practice.
- LCA results depend strongly on system boundaries, database and method. Comparison with results from other studies is of limited validity.
- The characterisation of microplastic impacts within life cycle assessment is still under methodological development.
- Open questions remain regarding the long-term environmental and health effects of microplastics, which we cannot answer.
Questions are welcome via contact.
FAQ
Evidence
Every figure on this page comes from a peer-reviewed publication. The full list is available under Technology / Publications. If you want to see the raw data or the measurement methodology behind any individual figure, write to us and we will provide it.
Further information