Removing microplastics from water and wastewater: clump & skim
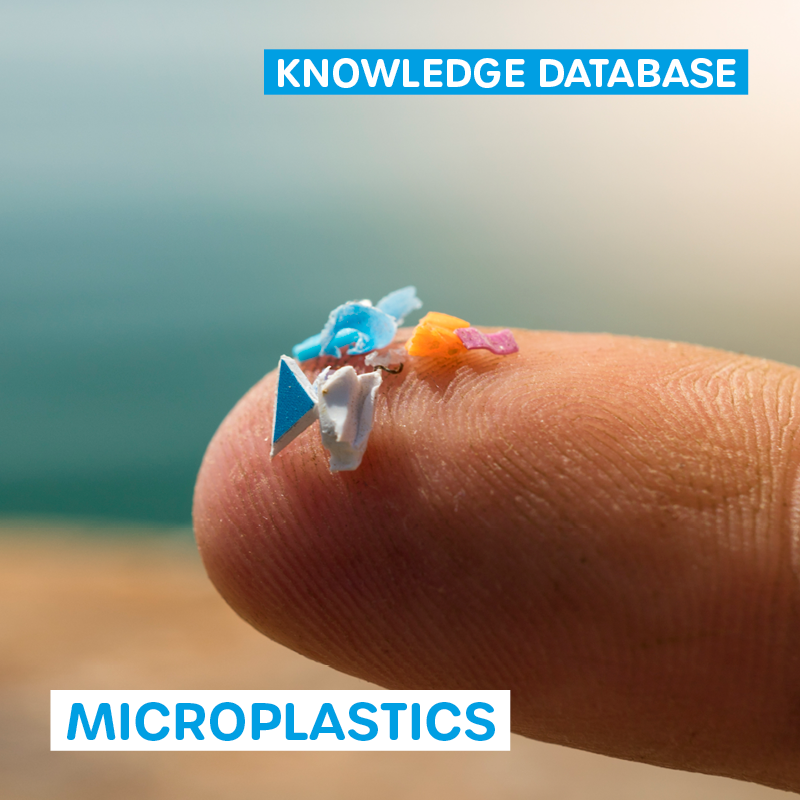
Wasser 3.0 PE-X® removes microplastics without filters. Instead of forcing particles through ever finer membranes, they are clumped into separable aggregates and skimmed off mechanically. Across four published pilot plants, removal ranged from 86 % to 99.1 %, depending on the water matrix.
This page gives the figures with their measurement conditions and sources — including where they diverge.
Last reviewed: August 2026 | Next review: December 2026
How does clump & skim work?
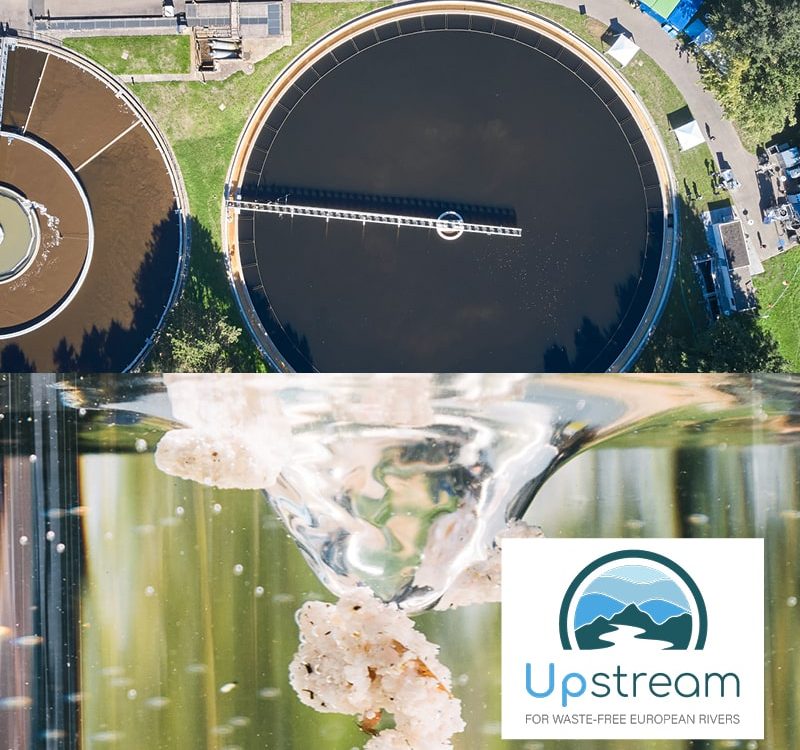
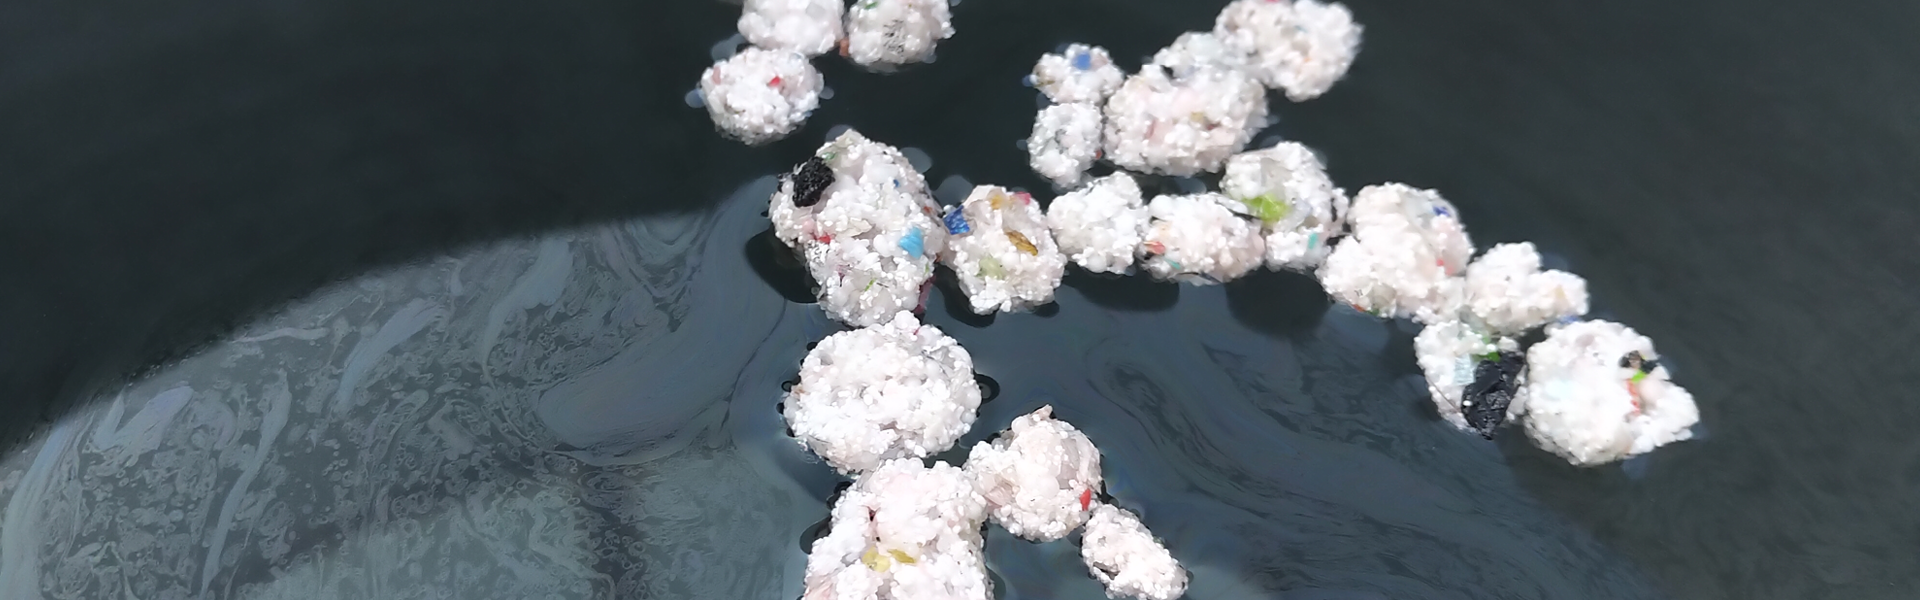
The process is based on hybrid silica gels that bind microplastic particles and bring them together into larger aggregates. The organosilicon precursors used form these hybrid silica gels in a water-induced sol–gel reaction; our publications therefore describe the process as organosilane-induced agglomeration–fixation (Clean Technol. 2026, 8, 32).
- The hybrid silica gel binds the particles into buoyant aggregates. The material composition is matched to the water matrix and the polymer spectrum.
- The agglomerates are separated using coarse-pored separation units — skimming or a belt filter. Fine filtration is not required; membranes and high pressure are dispensed with.
- The separated material enters a recovery concept. What happens to it today and what does not is set out under Reuse & Circularity.
The process is part of the EU Mission "Restore our Ocean and Waters".
How much microplastic does the process remove?
Between 86 % and 99.1 %, measured across four pilot sites. The range is the finding, not an imprecision.
|
Application |
Microplastic removal |
Further measured values and source |
|
Packaging production, Germany — automated pilot plant, 25 continuous test runs |
97.4 % (by mass) · 99.1 % (by particle count) |
COD −78.8 %; raw wastewater 1,725 ± 377 mg/L · Korzin et al., Clean Technol. 2025, 7, 67 |
|
Plastics processing, Germany — 8 test phases over 3 months |
98.26 ± 2.15 % (by mass) · 97.92 ± 2.31 % (by particle count) |
COD −94.3 ± 8.9 %; 1.1 kg of microplastics avoided per m³ · Sturm et al., Water 2024, 16, 268 |
|
Plastics processing, Germany — pilot plant with belt filter and activated carbon stage |
98.0 ± 1.1 % (by mass) · 99.9987 ± 0.0007 % (by particle count) |
COD −96 ± 2.7 %; turbidity −99.6 ± 0.1 % · Puhar et al., Water 2025, 17, 671 |
|
Mykonos WWTP, Greece — municipal wastewater after two-stage activated sludge |
86 ± 8 % |
Influent 633–5,843 MP/L, effluent 96–263 MP/L; TSS −95 ± 3 % · Sturm et al., Clean Technol. 2026, 8, 32 |
Why the figures diverge
Because effectiveness depends on polymer type, water composition and temperature. We investigated this systematically (Water 2021, 13, 675) and compared linear and branched precursors on polyethylene and polypropylene (Environ. Sci. Pollut. Res. 2020).
That is why we develop the material composition anew for each application, and why every project starts with a feasibility study using your water. A percentage from a brochure is no substitute for the trial — and anyone promising you polymer-independent performance is promising more than can be measured.
What the process consumes
Measured values from two plants so you can calculate: 0.8 kWh (Puhar et al. 2025) and 1.4 kWh (Korzin et al. 2025) of electricity per cubic metre of treated wastewater. Reagent input was 1.00 mL per m³ in one configuration and 0.7 L per m³ in the other — the formulations and water matrices differ, so we present both rather than averaging them.
What we do not infer from this: that the process is more energy-efficient or cheaper than filtration. No robust comparative LCA or cost comparison against filtration or oxidation processes exists; that is an open research question. For the municipal context we compared advanced treatment processes in Sustainability 2022, 14, 11605. The full life cycle assessment of our own process, including a trade-off, is on our Sustainability page.
What this means in engineering terms
- No membranes, no high pressure. Coarse-pored separation units instead of micro- or ultrafiltration.
- Modular and scalable from laboratory through pilot hall to full-stream operation, as a standalone solution or an add-on.
- Containerised rental model for long-term trials from one month, in batch or continuous operation.
- Multifunctional: alongside microplastics, micropollutants and COD are reduced as well; published COD figures range from 78.8 % to 96 %.
Where the process is used
Municipal wastewater treatment plants
The EU Urban Wastewater Treatment Directive (EU) 2024/3019 entered into force on 1 January 2025 and must be transposed by 31 July 2027. Article 21 requires the competent authorities to monitor microplastics at the inlet and outlet of treatment plants from 10,000 population equivalents. The directive sets no limit value.
Worth knowing for context: on our comparative measurements at three plants, microplastic contamination in the effluent of a four-stage plant does not differ significantly from that of a three-stage plant (Water 2025, 17, 711). Microplastics need a treatment stage designed for them. Our offering: Wastewater Treatment.
Industry and microplastic-free production
In the plastics value chain, removal at source is considerably more effective than removal at the end. At one packaging production site, a calculated 1.7 t of microplastics and 6 t of COD per year were kept out of the sewer system altogether (Clean Technol. 2025, 7, 67). For plastics processors, Regulation (EU) 2025/2365 has also applied since 16 December 2025, with documentation duties for pellet losses. Our offering: Industry.
- Plastics processing and production
- Textile industry (fibre breakage, microfibres)
- Recycling plants
- Paint shops and surface treatment
- Road drainage and car washes
Modular Plant Construction and Rental Model
Our systems are modularly constructed and can be provided as a rental model for long-term trials or as a permanent installation:
- Container-based Plug-and-Play solutions
- Batch or continuous operation
- Adaptable dosage and contact time – individually tailored to your process
- Integration into existing infrastructure as an add-on or standalone solution
- Scaling from pilot plant to industrial full-scale operation
Measure before you remove
Without a baseline measurement no removal performance can be demonstrated. Our microplastic analytics provide the reference values. How many samples you need depends on the precision you want: for a ± 25 % margin of error at 95 % confidence, 21 large-volume samples or 51 grab samples (Microplastics 2026, 5, 75).
Contribution to the UN Sustainable Development Goals
We map our work to the UN Sustainable Development Goals as a reference framework, not as a label. The SDGs are not a certification scheme and not third-party verification. Substantiated contributions with sources are set out on our sustainability page.
Next Step
Fill in the process parameter checklist or write to us directly: get in touch. We start with a feasibility study using your water.
Further information