Reuse and circularity: What is closed today and what is not
Wasser 3.0 works on two loops. The water loop functions at pilot scale. The material loop is not yet closed — the separated agglomerates currently go mostly to thermal recovery. This page states, for both, where we stand, what we have measured and what is still missing.
A circular economy page that conceals the open part of the loop is worthless. So we name it first.
Last reviewed: August 2026·| Next review: December 2026
Two loops, two levels of maturity
|
Loop |
Status |
Evidence |
|
Water — treated process water back into production |
Implemented at pilot scale; the percentages in circulation are estimates or modelling assumptions |
|
|
Material — agglomerates as a secondary raw material |
Not closed. Currently thermal recovery. Material reuse is calculated as an LCA scenario; no operating data exist |
The basis for both is microplastic removal by agglomeration and fixation. What circularity means in a water context generally is explained under Knowledge; the whole approach is set out in the technology overview.
The water loop: What is evidenced and what is estimated
Treated process water can be returned to production because chemical oxygen demand falls substantially alongside microplastics, and process chemicals such as surfactants stay in the water. COD reduction in the published pilot trials ranged from 78.8 % to 96 %.
- Up to 80 % water saving at the packaging production site — based on an estimated fourfold reuse (Korzin et al., Clean Technol. 2025, 7, 67). Not an operating value gathered over time.
- 9 m³ of reusable water per m³ of treated wastewater — a modelling assumption in the life cycle assessment (Puhar et al., Water 2025, 17, 671), not a measurement across multiple sites.
What reuse rate your process permits depends on your quality requirements. We establish it in a trial with your water rather than promising it in advance. More under offers for industry.
The material loop: What happens to the agglomerates today
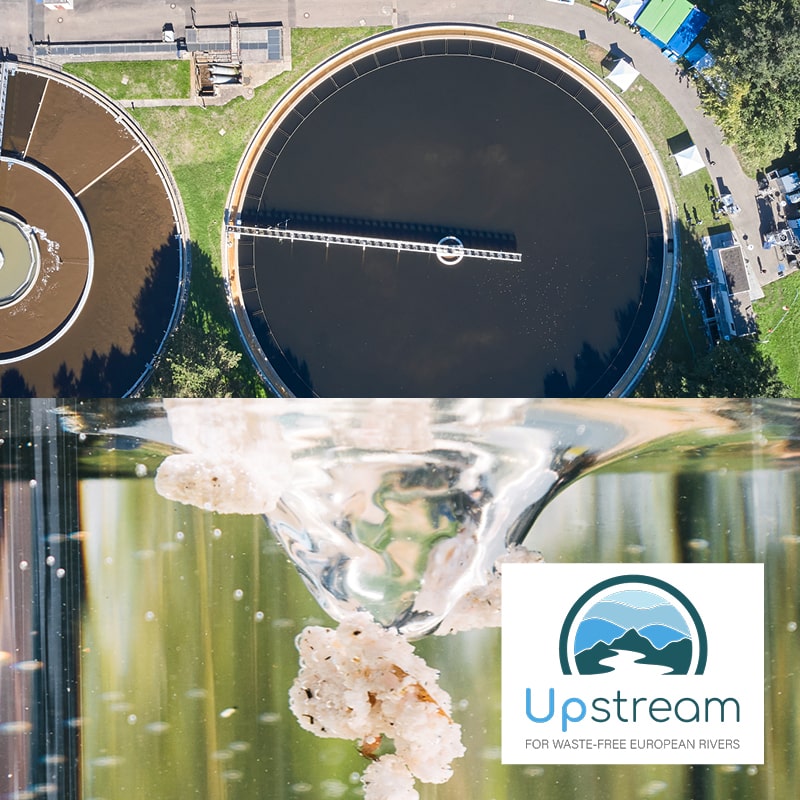
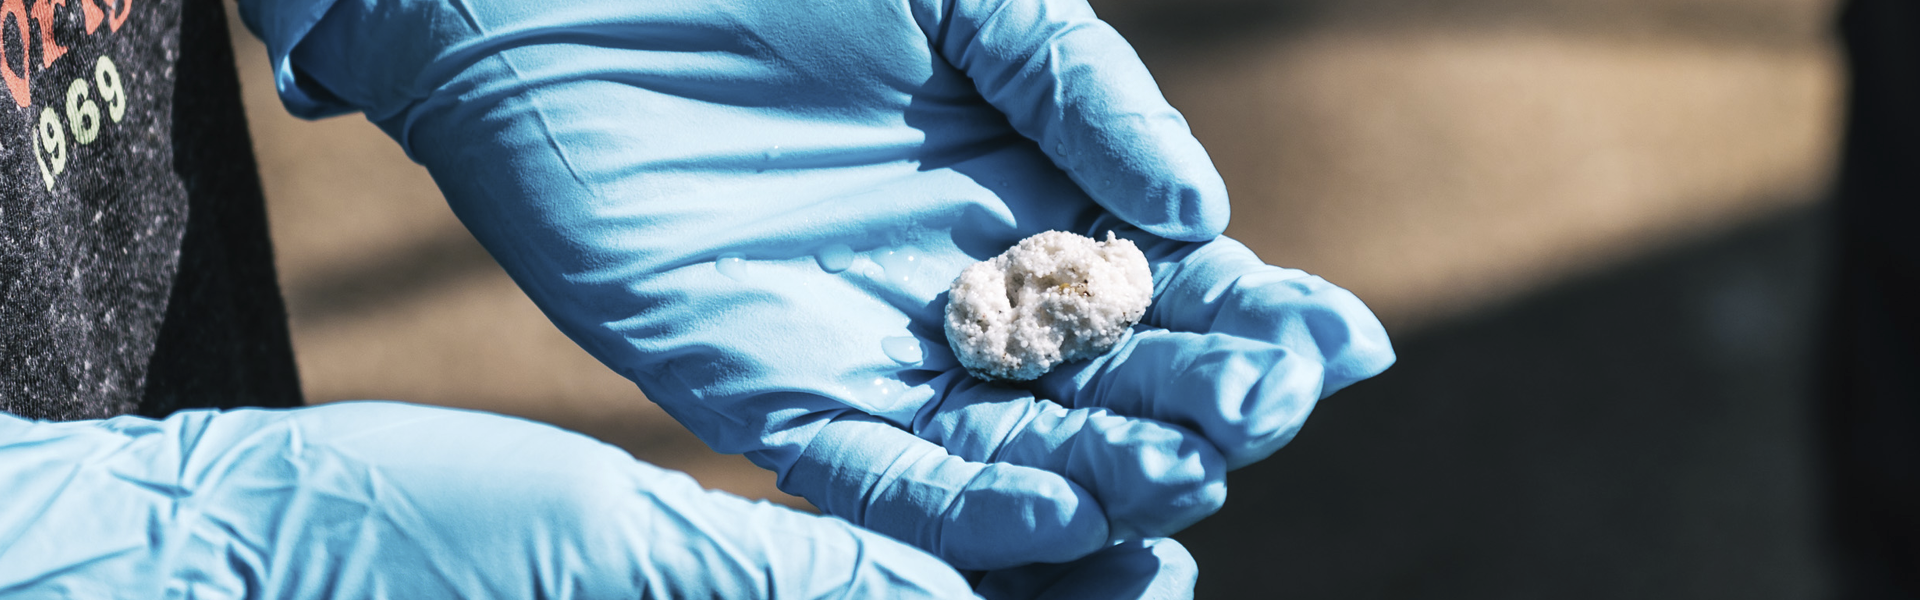
The process produces agglomerates — around 1.9 t of dry mass per year at the packaging production site (5.976 t wet, 4.423 t pressed), and a calculated 9.1 t per year at a second site.
An analysis in accordance with landfill legislation revealed that these agglomerates are not suitable for landfill, although recycling is not ruled out ((Korzin et al., Clean Technol. 2025, 7, 67). Research projects are already underway to describe and analyse the recycling process.
Why the material loop is not yet closed
Two legal hurdles, both with a sound basis.
- End-of-waste. The agglomerates are waste to begin with. Under the Waste Framework Directive 2008/98/EC, waste can cease to be waste once it has undergone a recovery operation and meets defined criteria — common use, an existing market, technical requirements, and no adverse environmental or health impacts. No such criteria exist for this material yet.
- Construction products law. For the obvious route into the construction sector, the Construction Products Regulation (EU) 2024/3110 has applied since 8 January 2026. Its Annex I states expressly that construction works must not pose a risk to the environment through the release of microplastics. A microplastic-bearing filler therefore has to demonstrate that it releases nothing in use. The corresponding standardisation work has been running since 2026.
Both hurdles are surmountable, but not by announcement. We are working on the demonstration and, until then, we say how things stand.
What a closed loop would deliver — and what it would cost
The life cycle assessment quantifies both. Together with the University of Maribor we assessed the process using the CML method (openLCA, Ecoinvent 3.9, functional unit one cubic metre of treated wastewater).
|
|
Pilot plant as operated |
Modelled circular scenario |
|
Global warming potential per m³ |
25.4 kg CO₂ equivalents |
1.0 kg CO₂ equivalents (−96 %) |
|
Filtration |
filter fleece, 36.7 km per year in batch operation |
endless belt filter |
|
Agglomerates |
thermal recovery |
material reuse as concrete filler |
|
Impact categories |
reference |
10 of 11 categories −78 to −97 % |
|
Eutrophication potential |
reference |
increases |
The eleventh category is the price of the loop. Eutrophication potential rises in the optimised scenario because the endless belt filter needs around 15 % more electricity and the energy-recovery credit from incineration disappears. Against the untreated baseline both variants perform considerably better; compared with each other, this is a trade-off (Puhar et al., Water 2025, 17, 671).
What the 96 % is not: not an achieved value, not a claim of climate neutrality, nothing to do with offsetting. It is a comparison between two plant concepts, and the circular scenario is so far a modelling assumption. The full account with system boundaries is on our Sustainability page.
We publish the figure anyway because it justifies the direction: the leverage sits with the filter fleece and with incineration. That is exactly where we are working.
Why we don't say "microplastic-free", but but pursue it as a goal
Because it isn't true. Our published removal rates range from 86 ± 8 % in municipal effluent (Clean Technol. 2026, 8, 32) to 99.1 % by particle count in heavily loaded industrial wastewater (Clean Technol. 2025, 7, 67). The effluent of the Mykonos pilot still contained 96 to 263 microplastic particles per litre.
There is also a limit to our detection method: tyre wear is not detectable by fluorescent staining, because its black colour quenches the fluorescence (Microplastics 2023, 2, 334). A freedom-from claim could therefore not be substantiated even with complete removal — because a fraction that matters by mass cannot be measured at all.
So we speak of substantially reduced microplastics and state the residual concentration. For returning process water to the loop, that number is the more useful one anyway: you need to know what stays in the circuit. It is measured with our microplastic analytics.
How we develop reuse concepts
We think about the end from the beginning — but we do not promise a result before the trial has run.
- Characterisation of the residue. Composition, contaminant levels, analysis under landfill regulations. Only then is it clear which recovery routes are open at all.
- Assessment of recovery routes in this order: material recovery, energy recovery, disposal. That ranking follows the waste hierarchy of the Waste Framework Directive.
- Legal assessment. End-of-waste, the product law of the target sector, and construction products law where relevant.
- Life cycle accounting. What environmental effects the chosen route has — using the same system boundaries as our published life cycle assessment.
This is part of our feasibility studies. The composition of the agglomerates depends directly on your water: polymer type, water composition and temperature govern both removal performance and the nature of the residue (Water 2021, 13, 675).
For treatment plants and for industry
Municipal treatment plants: from 10,000 population equivalents, Directive (EU) 2024/3019 requires monitoring of microplastics at inlet and outlet and, where relevant, in sewage sludge — in particular where it is reused in agriculture. That brings the fate of the removed material into view as well. Our offering: Wastewater Treatment.
Industry: for plastics processors, Regulation (EU) 2025/2365 has required annual documentation of estimated pellet losses since 16 December 2025. Here the water loop is both a cost and a compliance argument. Our offering: Industry.
Next step
Want to know which recovery route is realistic for your residue? Tell us what water you treat — we will characterise the residue and assess the routes.
This is the title
Further information