
Microplastic Mapping in Germany and Europe
22. July 2026
Ocean Bound Plastics
25. July 2026
Efficient microplastic removal from process water saves water, energy, and costs
What is this about? Process water is water that performs a technical function within a production process, such as cooling, rinsing or grinding. When it picks up plastic particles smaller than five millimetres, this is referred to as microplastics in process water. Unlike municipal wastewater, the origin, polymer spectrum and load level are fixed here and can be measured. That is exactly what makes process water a point at which retention can be achieved comparatively effectively and cheaply.
It’s not getting any easier; we all realise that. Increasing legal regulations for polymers, plastics, and microplastics, along with high costs for water, waste, energy, chemicals, and plant maintenance, as well as complex pollution scenarios – companies that use a lot of water, polymers and other chemicals in their processes are now facing the challenge of reorganising their environmental, waste, and resource management.
With Wasser 3.0 PE-X®, an adaptive and complete solution is available for a process upgrade for industrial water treatment. The process, which is based on organosilane-based agglomeration–fixation, filter-free separation and circular economy processes, focuses on the removal of microplastics. What is evidenced so far is the retention performance and the reusability of the treated water: in a pilot trial at a packaging production line, 97.4 % of the microplastics by mass and 99.1 % by particle count were retained, COD fell by 78.8 %, and up to 80 % of the process water could be reused (Clean Technol. 2025, 7, 67). Statements on acquisition and operating costs are site-dependent and are addressed separately below.
Microplastics - danger recognised, danger averted?
|
FACT-CHECK NOTE How to read the percentages: removal rates are determined via mass, via particle count or via total suspended solids, depending on the question. The three values differ markedly within the same trial. For the packaging production line they are 97.4 % by mass and 99.1 % by particle count (Clean Technol. 2025, 7, 67). The detection limit of the analytical method is 10 µm; smaller particles are not included in any of these figures. |
Microplastics in the water cycle have become a global and constantly growing environmental problem, with public awareness rising thanks to buzzword journalism and fatalistic communication.
These small plastic-based particles (< five millimetres) have been detected from the Arctic to the deep sea to Mount Everest, in food, animals, and in humans. Their potential risk to humans and the environment is increasingly scientifically analysed with a large amount of potential negative impacts now being reported.
For aquatic organisms, physical effects such as uptake, injury and reduced food intake are described in numerous laboratory studies; whether these translate to field concentrations is the subject of ongoing research. For humans, the detection of particles in tissues and body fluids has been published repeatedly. A causal link between microplastic or nanoplastic exposure and specific conditions such as cancer, organ failure or stroke is not established on current evidence; the available findings are associative. The difference between detection, association and causation is decisive here. Yet despite the knowledge of the risk potential posed by microplastics, little is being done to actively combat their spread.
Laws and regulations on the horizon
Legal regulations against the previously unhindered entry of microplastics into the environment are emerging at both a European and national level. Since this post appeared they have become concrete: the recast EU Urban Wastewater Treatment Directive, Directive (EU) 2024/3019, entered into force on 1 January 2025. It lowers the application threshold from 2,000 to 1,000 population equivalents, requires a quaternary treatment stage for micropollutants and, under Article 17, obliges Member States for the first time to monitor microplastics. The transposition deadline is 31 July 2027. It contains no emission limit value for microplastics. For companies that produce, process, or dispose of polymers and plastics, this means reorganising their environmental, waste, and resource management.
This is because microplastics accumulate wherever there are polymers or plastics. These are not only found in products such as packaging, synthetic textiles, and car tires. They are also components in cosmetics, cleaning agents, fertilisers, coatings, and paints and used as additives in a wide range of industrial processes, such as paper production.
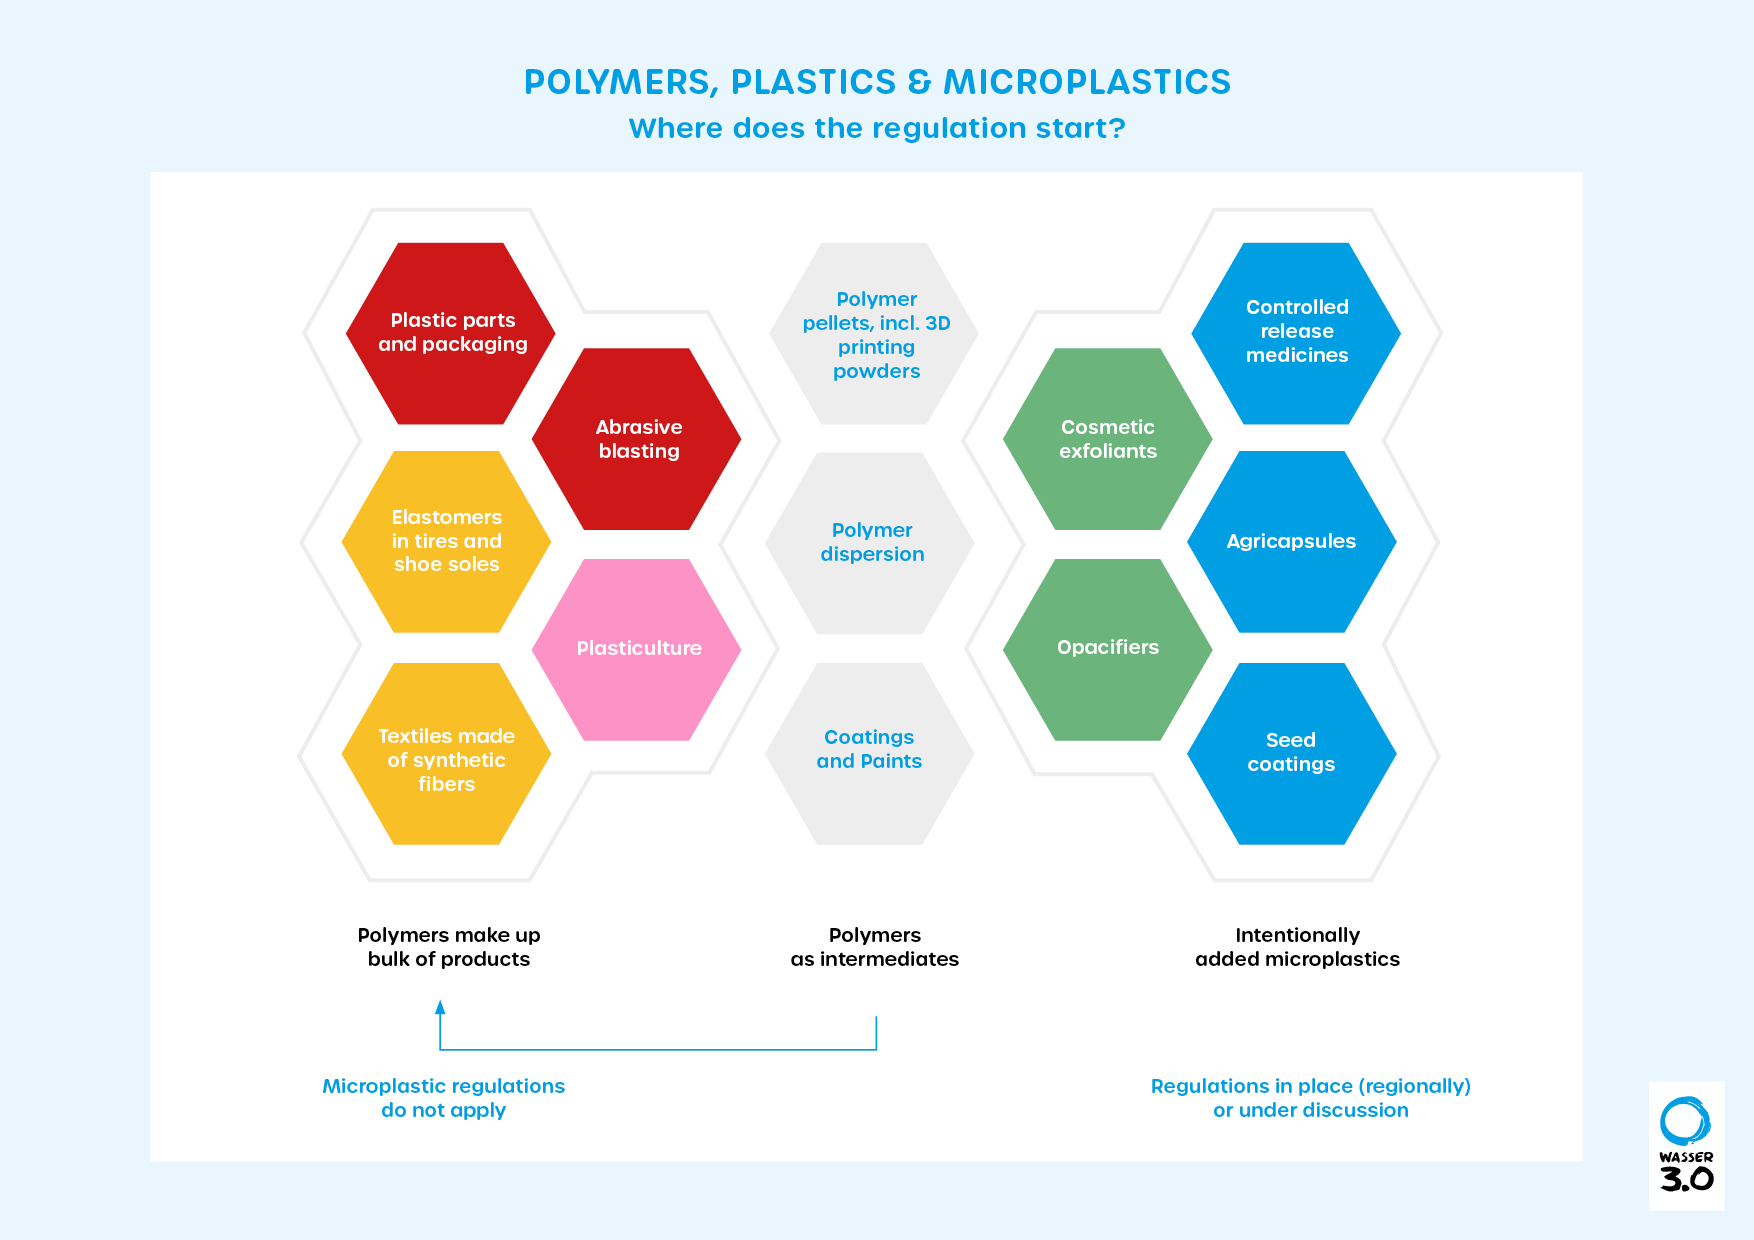
Overview of polymers in different products; categorisation and regulations from the perspective of microplastics ©Wasser 3.0
Microplastic particles and dissolved pollutants: cost drivers in industrial processes
Global plastics production is in the order of around 400 million tonnes per year, made from over 200 types of polymer. Polymers are fundamental components of industrial production processes, found in many forms and types of applications, just like water. They often lead to high operating costs for traditional water treatment systems that are also maintenance intensive.
In addition, many industrial wastewaters are significantly contaminated with microplastics, soluble polymers (these are categorised as micropollutants and not microplastics), and other pollutants. Our own measurements show how high the load can be: 1,725 ± 377 mg/L of microplastics and 7,570 ± 1,339 mg/L COD in raw wastewater from packaging production (Clean Technol. 2025, 7, 67), and 8,450–9,940 mg/L COD in wastewater from a plastics processor (Water 2025, 17, 671).
These complex and diverse pollution scenarios cannot be adequately treated in conventional – industrial and municipal – wastewater treatment plants. This holds for advanced treatment stages too: comparing three municipal plants with two, three and four treatment stages, no significant differences in effluent microplastic concentrations were found (Water 2025, 17, 711). The consequences are rising wastewater charges due to the need for retrofitting, the high costs for the disposal of residual materials, and increasing requirements for industrial discharges into water bodies and sewerage systems.
Low-microplastic production and recycling of secondary materials
It is not only potential future legislations that make it sensible to address the issue of microplastics in industrial water. Water, waste, and energy are all factors that may have a negative impact on companies’ economic and ecological balance sheets. They all change measurably with the implementation of the Wasser 3.0 PE-X® process; the direction and extent of that change depend on the plant configuration and are reported per scenario in the life cycle assessment (Water 2025, 17, 671). Here, the holistic process approach and circular economy process design play a key role. One of the main advantages lies not only in the process itself, but also in the fact that the microplastic agglomerates can be further utilised in a circular economy, whereby they may be utilized in the construction sector. In the life cycle assessment, the use of dried agglomerates as a filler in concrete mixtures replacing silica sand was modelled; this pathway has so far been calculated as a scenario and is not documented as current practice. This step means that industrial and municipal wastewater treatment plants not only clean wastewater efficiently and easily, but also reuse waste streams at the same time. Production with a markedly reduced microplastic discharge is therefore possible. The term "microplastic-free" is deliberately avoided, because a freedom-from claim would require evidence of absence below the limit of quantification, which cannot be provided at a detection limit of 10 µm.
And maybe the most interesting point from economic perspective: Not only the waste itself can be reused (which also reduces the costs of waste disposal and can generate revenue through the production of construction materials) but also the process water can be reused, which saves a significant amount of money on fresh water and wastewater disposal. In the pilot trial at a packaging production line, up to 80 % of the process water was reusable (Clean Technol. 2025, 7, 67). How much this is worth in monetary terms depends on local fresh-water and wastewater tariffs and is calculated site by site.
Microplastic removal as a lever for resource- and energy-saving process optimisation
To achieve low-microplastic production using Wasser 3.0 PE-X®, both the basic minimalist and modular system design and the hybrid silica gels are customised. In accordance with the process-related requirements for separation, time, and water quantity, the system has been designed so that defined quantities of wastewater can be processed in batches and in continuous operations. For a tank size of 200 L, around 2 m² of space is required. The system could therefore be easily integrated into the existing process environment.
A peer-reviewed life cycle assessment is available for the process (Puhar et al., Water 2025, 17, 671). It accounts for construction, operation and end-of-life over an assumed service life of 30 years at 2,000 m³ of treated wastewater per year, referenced to a functional unit of 1 m³. Result: 25.4 kg CO₂ equivalents per m³ for the pilot plant studied and 1.0 kg CO₂ equivalents per m³ for an optimised circular concept. The dominant burden in pilot operation is the polyester filter fleece, at 36.7 km consumed per year. In 10 of 11 impact categories the burdens fall by 78 to 97 % in the optimised concept; in the eutrophication category they rise, because the endless belt filter draws more electricity. These figures compare two of the company’s own plant variants and say nothing about competing technologies.
On costs, only site-specific statements can be made on the present evidence. Documented for the process are electricity consumption of 0.8 kWh per m³ of treated wastewater, a dosing requirement of 1.0 mL of organosilane per m³, and an annual activated carbon volume of 175 L at a throughput of 2,000 m³ (Water 2025, 17, 671). We do not state a general saving rate for investment or total operating costs, because it depends on site, plant size and observation period.
Potential for more climate and environmental protection while reducing costs at the same time
The process has since been trialled in several plastics- and water-intensive operations as well as at municipal wastewater treatment plants; published removal rates range from 86 ± 8 % to 99.1 % by particle count. In addition to improving water quality, the following effects are measurable: reuse of up to 80 % of the process water (Clean Technol. 2025, 7, 67), recovery of the agglomerates as a secondary raw material, and a reduction of the COD load by 78.8 to 96 % depending on plant and wastewater. A net saving of CO₂ emissions is deliberately not claimed here: the life cycle assessment reports a positive global warming potential for the treatment itself, which only falls to 1.0 kg CO₂ eq. per m³ in the optimised circular concept. The mapping to the UN Sustainable Development Goals is a self-imposed orientation, not an audited certification.
With the implementation of low-microplastic production, companies that produce, process, and dispose of plastics are entering the age of sustainability and circular economy. Whether the investment pays off depends on the individual case. The economic levers can be named: fresh water saved, wastewater charges avoided via the COD load, disposal costs avoided, and revenue from recovering the agglomerates. Whether the sum of these items exceeds the investment and operating costs is calculated in the feasibility study for the specific site. A general claim that environmental protection always reduces costs in this application is not substantiated.
So, when will you start?
|
TRANSPARENCY NOTE ON SOURCES AND DATA STATUS The life cycle assessment values refer to a functional unit of one cubic metre of treated wastewater, calculated with the CML method using openLCA 2.0 and Ecoinvent 3.9, assuming a 30-year service life and a throughput of 2,000 m³ per year. Cost figures are site-dependent; no general saving rate is stated. Figures on global plastics production are given as an order of magnitude, because robust annual values can only be taken from the current primary statistics. Research status: September 2026. |