Ocean Bound Plastics
25. July 2026
dm-drogerie markt becomes Kilometre Partner of DANUBE 2850
11. August 2026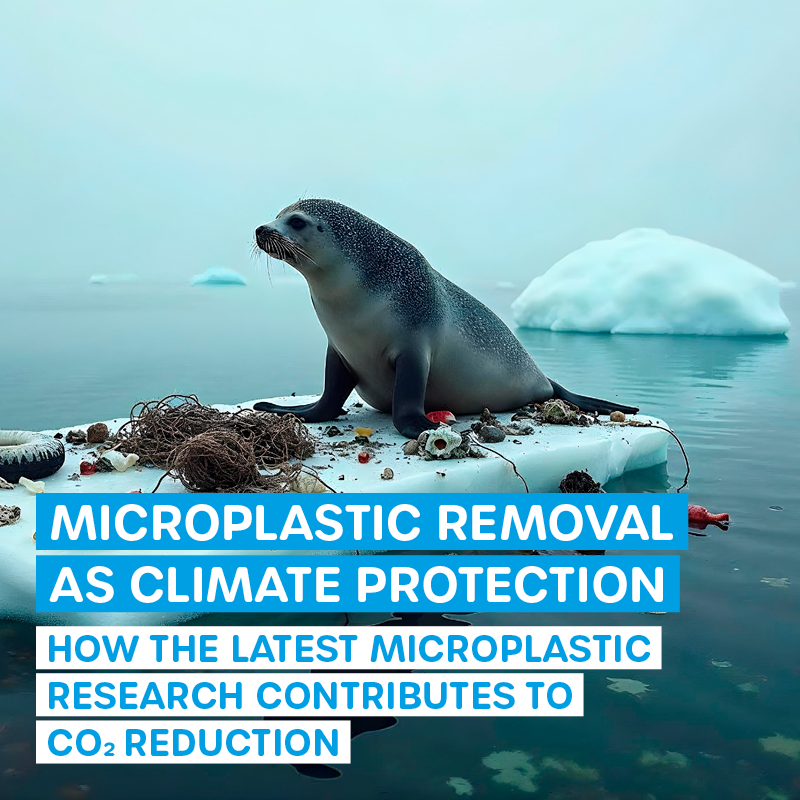
Microplastics and climate: what the research shows – and what is still open
Microplastics interfere with processes that matter for the global carbon cycle. How strongly removal at hotspots translates into a climate effect has not been quantified.
A framing note first: "climate impact" covers two independent questions in this text. First: does microplastic itself contribute to the greenhouse effect, for instance by releasing gases as it degrades or by disturbing biological carbon sinks? Second: can the greenhouse gas avoided by removing microplastics be quantified? There are published findings for the first question. For the second, no established calculation method exists. This distinction is decisive for how the figures below should be read.
Climate change and microplastic pollution – two of the most pressing environmental problems of our time are more closely linked than previously assumed. Current research shows: microplastics are not only a problem for the environment, but also an influence on climate-relevant processes that is under discussion. At the same time, targeted removal of microplastics at identified hotspots offers a way to reduce those influences. No conversion factor from removed microplastic mass to avoided greenhouse gas emissions is currently available.
When Microplastics Heat Up the Climate
Estimates of the number of microplastic particles at the ocean surface range, depending on model, size class and data basis, in the order of several hundred trillion particles; quantities in deeper water layers are largely unknown. A robust figure requires the size class, method and uncertainty range to be stated.
Microplastics as Greenhouse Gas Producers
When plastic degrades in the environment, climate-active gases are produced under certain conditions. Polyethylene and polystyrene – the most common plastics – release methane and ethylene during UV decomposition. The methane then reacts in the atmosphere to form carbon dioxide (CO₂), intensifying the greenhouse effect. The key point: the smaller the particles, the larger the surface area – and the more greenhouse gases are released. These findings come predominantly from laboratory trials under defined UV irradiation. The contribution to the global methane budget is not quantified on current evidence and is assessed as small relative to the known main sources. The statement "microplastics heat up the climate" is therefore evidenced as a mechanism, not as a quantifiable climate contribution.
Attack on the Biological Carbon Pump
|
FACT-CHECK NOTE On monetary valuations: valuing the annual oceanic carbon uptake at a CO₂ price yields a figure in the hundreds of billions. That figure quantifies the total value of the sink, not damage avoided by microplastic removal. The underlying quantity is also unit-critical, because the literature reports it both in gigatonnes of carbon and in gigatonnes of CO₂; the two differ by a factor of 3.67. |
Even more serious is the disruption of the marine carbon pump. Latest studies show: microplastics threaten one of Earth’s most important climate regulators – the ocean. The ocean stores around 38,400 petagrams of carbon, that is 38,400 × 10¹⁵ grams or roughly 3.8 × 10¹³ tonnes – more than all other carbon reservoirs combined outside the Earth’s mantle..
The biological carbon pump works like this: phytoplankton binds atmospheric carbon dioxide through photosynthesis. Zooplankton eats the algae and excretes carbon-rich fecal pellets that sink into the deep sea. There, the carbon is stored for millennia.
Microplastics disrupt this process:
- Plastic particles block light and reduce photosynthesis of phytoplankton
- Microplastics in fecal pellets change their sinking speed
- Carbon transport to the deep sea is disrupted
The three mechanisms named are described in laboratory and mesocosm studies. How large the effect is on actual oceanic carbon uptake is the subject of ongoing research and is not yet supported by robust figures.
Microplastics Research: Hotspot Hunting for Effective Measures
This is where our innovative microplastics research comes in. With systematic microplastics mapping, we identify the locations where microplastic removal achieves the greatest relief for the water body.
Concrete Results from Practice
|
FACT-CHECK NOTE On the robustness of single values: microplastics are distributed inhomogeneously in water bodies. The relative standard deviation is 64 ± 19 % for grab samples and 41 ± 17 % for large-volume filtration with the Particle Sampling Unit. Securing a mean within a ±25 % margin of error (95 % confidence interval) requires 21 PSU or 51 grab samples (Microplastics 2026, 5, 75). Individual hotspot values are snapshots. |
Our river sampling shows continuous pollution with dramatic differences in pollution levels. The values were obtained by fluorescent labelling and automated particle counting at a detection limit of 10 µm (Microplastics 2025, 4, 63):
- Alb: Microplastics from mouth to source in all samples
- Queich: Average of 240 microplastic particles per liter, with a hotspot of 944 particles/liter
- Rehbach: Increased concentrations before Rhine confluence due to lower dilution
- Even at sources: Even in supposedly "clean" source areas, we find 4 particles/liter
The main sources are identified: tire wear from highways, intensive agriculture, wastewater treatment plants, and landfills. The relative importance of these sources varies over short distances and cannot be derived as a fixed ranking from the available measurements.
Innovation Makes the Difference
What makes our project special: the speed and precision of analysis. While conventional FT-IR spectroscopy takes days, our fluorescence microscopy with selective MP-1 markers delivers results in hours. The time advantage concerns the evaluation of the filter membrane; sample preparation and digestion are required for both methods. Unlike FT-IR, fluorescent labelling does not identify the polymer. The comparison is therefore one of differing performance profiles, not of general superiority (Analytica 2023, 4, 27–44; Microplastics 2023, 2, 334–349).
Our mobile Particle Sampling Unit (PSU) enables standardized sampling with 100+ liter volumes – significantly more representative than previous methods. This is now quantitatively evidenced: mean relative standard deviation 41 ± 17 % against 64 ± 19 % for grab samples, with recovery rates of 88 ± 23 % (PSU) and 93 ± 7 % (grab) (Microplastics 2026, 5, 75), while the citizen science approach with our analytical kits makes data collection scalable.
What can be quantified – and what cannot
-
Evidenced relationships
There is evidence for the following points. They describe the scale of the system affected, not the effect of a removal measure:
- Size of the oceanic carbon sink: the ocean takes up net carbon in the order of a few gigatonnes per year. Valuing that quantity at a CO₂ price of USD 150/t yields a calculated monetary value in the hundreds of billions. Important: this figure quantifies the total value of the oceanic sink, not damage avoided by microplastic removal. The underlying quantity is also unit-critical, because oceanic net uptake is reported in the literature both in gigatonnes of carbon and in gigatonnes of CO₂; the two differ by a factor of 3.67.
- Gas release during degradation: less microplastic in the environment mechanistically means less methane and ethylene release. The quantity avoided per kilogram of microplastic removed has not been quantified.
- Preservation of blue carbon ecosystems: Mangroves, seagrass beds, and salt marshes are particularly productive carbon stores per unit area
On the hotspot strategy
Our hotspot strategy rests on the working assumption that the load is unevenly distributed across sources and that measures at a few heavily loaded points achieve more than area-wide measures. A fixed 80/20 distribution is not evidenced for microplastics. What our own measurements do support is the uneven distribution as such: in the Queich, the average and the hotspot differed by a factor of four. It is also evidenced that removal works more efficiently at high starting loads: in industrial wastewater with 673 ± 183 million particles per litre, 99.1 % were removed by particle count, whereas in wastewater treatment plant effluent with 29.1 ± 15.1 particles per litre only 60.9 ± 27.5 % were removed (Clean Technol. 2025, 7, 67; Water 2024, 16, 268).
Breaking the Vicious Cycle
Particularly problematic: climate change and microplastics mutually reinforce each other. Higher temperatures accelerate plastic degradation and extreme weather distributes microplastics more widely. At the same time, more microplastics means more greenhouse gases are produced.
Our microplastic removal addresses this relationship. The following effects are plausible in direction and described mechanistically; none of the three has been quantified:
- Immediate effect: Less plastic degradation = fewer greenhouse gases
- Medium-term effect: Protection of the biological carbon pump
- Long-term effect: Stable marine carbon stores
Technology That Works
Our Wasser 3.0 technology makes microplastic removal measurable:
- Agglomeration and separation: Quantifiable removal in kilograms and tons – 1.7 t of microplastics per year is evidenced at one packaging site (Clean Technol. 2025, 7, 67) and 2.7 t per year is projected at a plastics processor (Water 2024, 16, 268)
- Circular economy: Recycling of removed microplastics – calculated as a filler scenario in the life cycle assessment, not documented as current practice
- Scalable application: Mobile systems for various water body types
Completeness requires the other side of the ledger: the treatment itself causes greenhouse gas emissions. The available life cycle assessment reports 25.4 kg CO₂ equivalents per m³ of treated wastewater for the pilot plant studied and 1.0 kg CO₂ equivalents per m³ for an optimised circular concept (Water 2025, 17, 671). A climate balance for microplastic removal that sets this expenditure against avoided climate damage does not yet exist, because the credit side cannot be quantified.
From Research to Practice: Immediate Measures for Maximum Relief
- Hotspot treatment: Landau wastewater treatment plant with 4th treatment stage + microplastics removal
- Preventive measures: Source reduction and low-microplastic alternatives
- Continuous monitoring: Standardized protocols for long-term observation
International Scaling
The Global Map of Microplastics becomes the database for worldwide water protection measures. Technology transfer and international cooperation multiply the impact.
Conclusion: an evidenced relationship, an open quantification
The relationship between microplastics and climate-relevant processes is described in the literature. A calculation path translating removed microplastic mass into avoided greenhouse gas emissions does not yet exist. As long as it is missing, the statement that microplastic removal is a climate protection measure is a plausible hypothesis, not an evidenced effect. Systematic hotspot identification and targeted removal can:
- reduce pressure on the biological carbon pump; the extent is not quantified
- reduce the quantity of microplastic from which climate-active gases arise during degradation
- contribute to protecting marine and terrestrial carbon stores
Time is running out. While plastic production continues to rise, our data shows: targeted microplastic removal at hotspots is technically feasible and measurable in its removal performance. The contribution to climate protection is therefore not quantified, but the relief for water bodies is.
It’s time to treat microplastic pollution not just as an environmental problem, but as a topic with climate-relevant connections. The technology is there and the hotspots are identified – now the task is to close the causal chains quantitatively.
|
TRANSPARENCY NOTE ON SOURCES AND DATA STATUS The studies linked in the text are peer-reviewed, except for the reference on light attenuation, which is marked as a trade journal article. No calculation path translating removed microplastic mass into avoided greenhouse gas emissions exists on current evidence; statements on climate effect are therefore framed as mechanisms rather than as a quantified contribution. River values are snapshots from individual sampling campaigns. Research status: September 2026. |