
Microplastics regulation
10. July 2026
Microplastic removal saves water, energy, and costs
23. July 2026
Three Rivers, One Map: How We Are Making Europe's Microplastics Visible
There is one sentence that has accompanied us for years: "We know that microplastics are everywhere – we just don't know exactly where". This year, that statement has reached its expiration date. Through our campaigns along the Neisse, Neckar and Danube, we have created the most comprehensive and spatially connected dataset on microplastic pollution in Central European rivers to date. And we are making it publicly available.
The Numbers: What We Have Achieved So Far
For us, mapping does not mean collecting a handful of samples from easily accessible bridges. Mapping means systematic, georeferenced sampling along the entire river, using one consistent methodology from source to mouth. Current status:
- Lusatian Neisse: 112 samples – from the Jizera Mountains to the confluence with the Oder, including two samples from the Oder itself and eight from adjacent lakes.
- Neckar: 161 samples – from the river's source to its confluence with the Rhine, including 13 samples collected in the Bonadies Harbour area in Mannheim.
- German section of the Danube: from Donaueschingen to Passau and onward to Aschbach on the Danube – the Danube Challenge, our ongoing campaign along the longest continuous river section we have ever surveyed.
- Brigach and Breg: 11 samples – the two headwaters of the Danube, sampled before the official launch of the Danube Challenge.
As of today, this amounts to 369 samples – and every single one represents a data point that simply did not exist before.
For comparison: when we completed the first comprehensive survey of the Alb River near Karlsruhe in 2023, it was considered a milestone. Today, this has become our standard approach – only on a much larger scale.
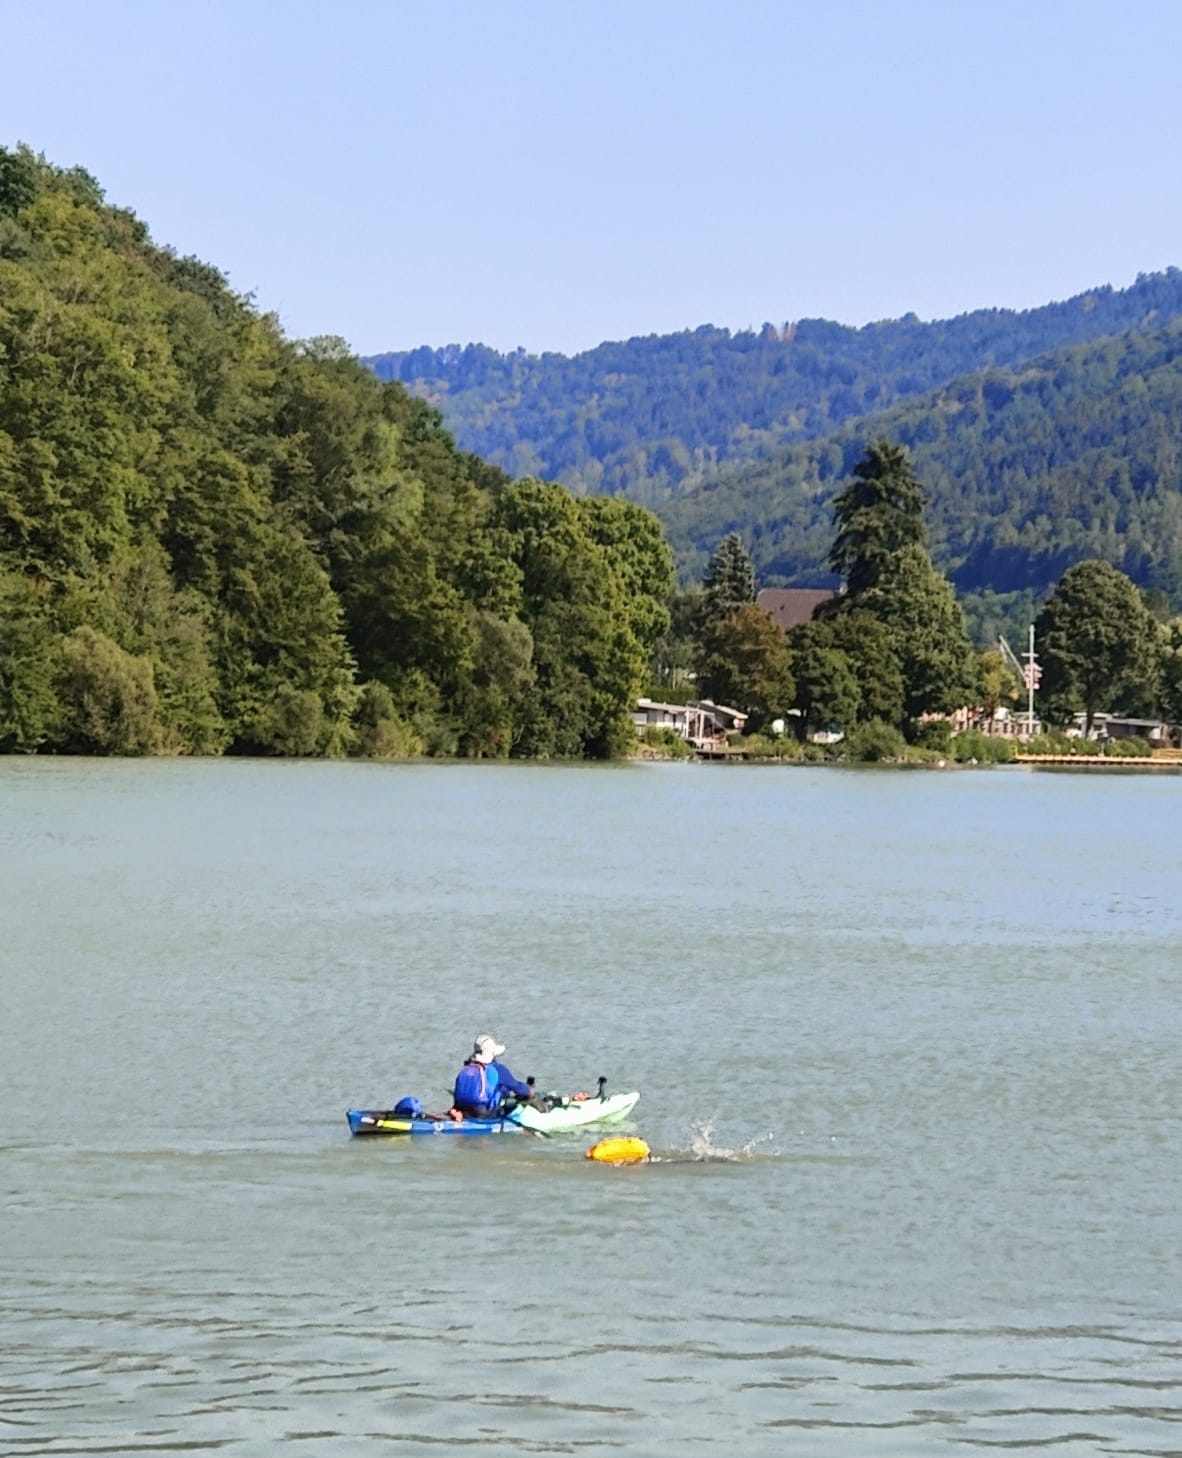
Joseph and Thorsten at the Danube Challenge © Wasser 3.0
Why These Three Rivers?
The selection was no coincidence; it was part of the experimental design. Together, these three rivers represent almost the entire spectrum of conditions found in European river systems.
The Neisse is a transboundary river flowing through three countries with a long industrial history. The upper reaches around Liberec have been known as the "Manchester of Bohemia" since the 16th century, with textile mills and weaving factories located directly along the river. Textile wastewater and synthetic fibres are among the most important sources of microplastics. There are few better real-world laboratories for studying how long historic industrial pollution continues to influence river systems.
The Neckar represents a test case for population and infrastructure density. More than four million people live along its course, with a high concentration of settlements and wastewater treatment plants in a relatively small area. With 161 samples, it provides our highest spatial resolution and therefore the best opportunity to distinguish individual emission pathways from one another.
Finally, the Danube represents the European dimension: ten countries, approximately 2,850 kilometers, and a catchment area where millions of people rely on the river for their drinking water. The DANUBE 2850 campaign is currently underway. With 85 analysed samples up to Aschbach so far, the journey is far from over.
The Real Leverage Is Data Transparency
This is where our work fundamentally differs from conventional research. We could collect these data, spend three years analysing them, and then publish a paper hidden behind a paywall. Instead, we are doing the exact opposite. Every result feeds directly into the Global Map of Microplastics – openly accessible, standardised, and freely available to everyone.
Why does this matter? Because the absence of reliable data remains the strongest argument against effective regulation. As long as no one can confidently answer how much microplastic is present in which water body, every political measure remains open to challenge. Estimates, for example, of the microplastic loads carried by the Danube have circulated for years. But they remain exactly that: estimates without a validated measurement basis. Without evidence, policy cannot act.
Data transparency is therefore not a by-product of our work; it is its driving force. A publicly accessible map containing 369 sampling locations changes conversations. It changes what a wastewater treatment plant operator can say about the quality of their effluent. It changes what municipalities include in their river management reports. And it changes the discussions taking place in Brussels.
From Map to Hotspot: What the Data Already Reveal
Across all campaigns, a clear pattern emerges: The closer a monitoring site is to a wastewater treatment plant, the more microplastics are found in the water. Just a few kilometers downstream, the levels drop significantly. This is the typical hallmark of a point source.—that is, a clearly identifiable location where the plastic enters the water. And that’s good news: What can be precisely located can also be addressed. If you know where the pollution originates, you can allocate funds for water protection exactly where they’ll have the greatest impact—rather than spreading them thinly.
This speed is made possible by a specially developed microplastic analysis method: A dye makes plastic particles in the water glow—so they are made visible instead of being laboriously identified one by one. This is faster, more cost-effective, and works without a large laboratory. Only this makes water monitoring along entire rivers feasible in the first place. Anyone who wants to use the method themselves can find the appropriate analytics kit.
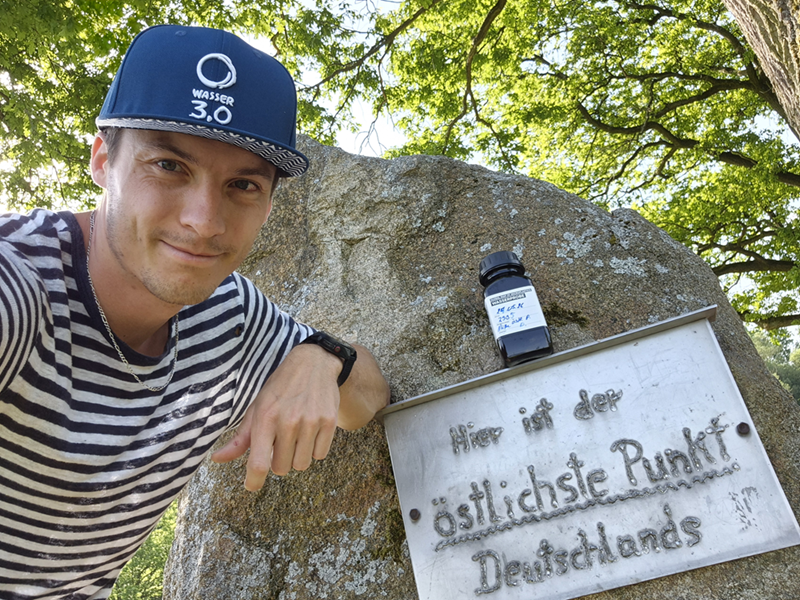
Oleg at Germany's easternmost point on the Neisse River © Wasser 3.0
Scaling Up Through Microplastic Analysis
The sample throughput we can achieve simply cannot be matched by conventional laboratory methods. Although FTIR spectroscopy is widely regarded as the gold standard, it has important limitations. It struggles to detect particles below approximately 10–20 micrometers, requires extensive sample preparation, expensive laboratory infrastructure, and highly specialized personnel. For monitoring programs on this scale, it is therefore of limited practical suitability.
Instead, our microplastic analytics uses fluorescent markers that selectively stain plastic particles. This enables them to be reliably distinguished from natural particles and quantified rapidly, cost-effectively, and without the need for a fully equipped analytical laboratory. Only this level of scalability makes comprehensive river monitoring a realistic possibility. Anyone wishing to implement the methodology themselves can obtain the appropriate analytics kit directly from us.
Part of the EU Mission Ocean – What That Actually Means
Our mapping activities are embedded within the EU Mission "Restore our Ocean and Waters", one of the flagship missions under Horizon Europe. By 2030, the mission pursues three overarching objectives: protecting and restoring marine and freshwater ecosystems, preventing and eliminating pollution in oceans and inland waters, and enabling a sustainable, climate-neutral and circular blue economy.
The mission operates through regional focus areas known as Mission Lighthouses. One of these covers the Danube River Basin and the Black Sea. To date, more than 1,000 actions have been recognized under the Mission Charter, supported by a combined budget exceeding €7.7 billion.
For us, this is far more than a label. It represents a clear division of responsibilities. The Mission defines the framework and the objectives. What it needs are robust, comparable and openly accessible data collected directly within Europe's river basins. That is exactly what we provide. A sampling location on the Neisse is therefore more than just a sampling location on the Neisse. It is part of a European body of evidence that must ultimately support better environmental policy and regulation.
Game Changer Instead of Symptom Management
Mapping alone does not clean a river. That is why, for us, mapping is only one pillar of a much broader approach. At the same time, we are developing technologies to remove microplastics from wastewater streams before the particles ever reach rivers. We publish our methodology in peer-reviewed scientific journals so that others can apply, validate and build upon it. And we translate scientific findings into accessible knowledge for everyone, not just chemists and environmental scientists.
This combination of measuring, publishing, removing and explaining is what we at Wasser 3.0 gGmbH describe as our Game Changer approach. It is not about a single technological breakthrough. It is about consistently closing the gap between scientific knowledge and practical action.
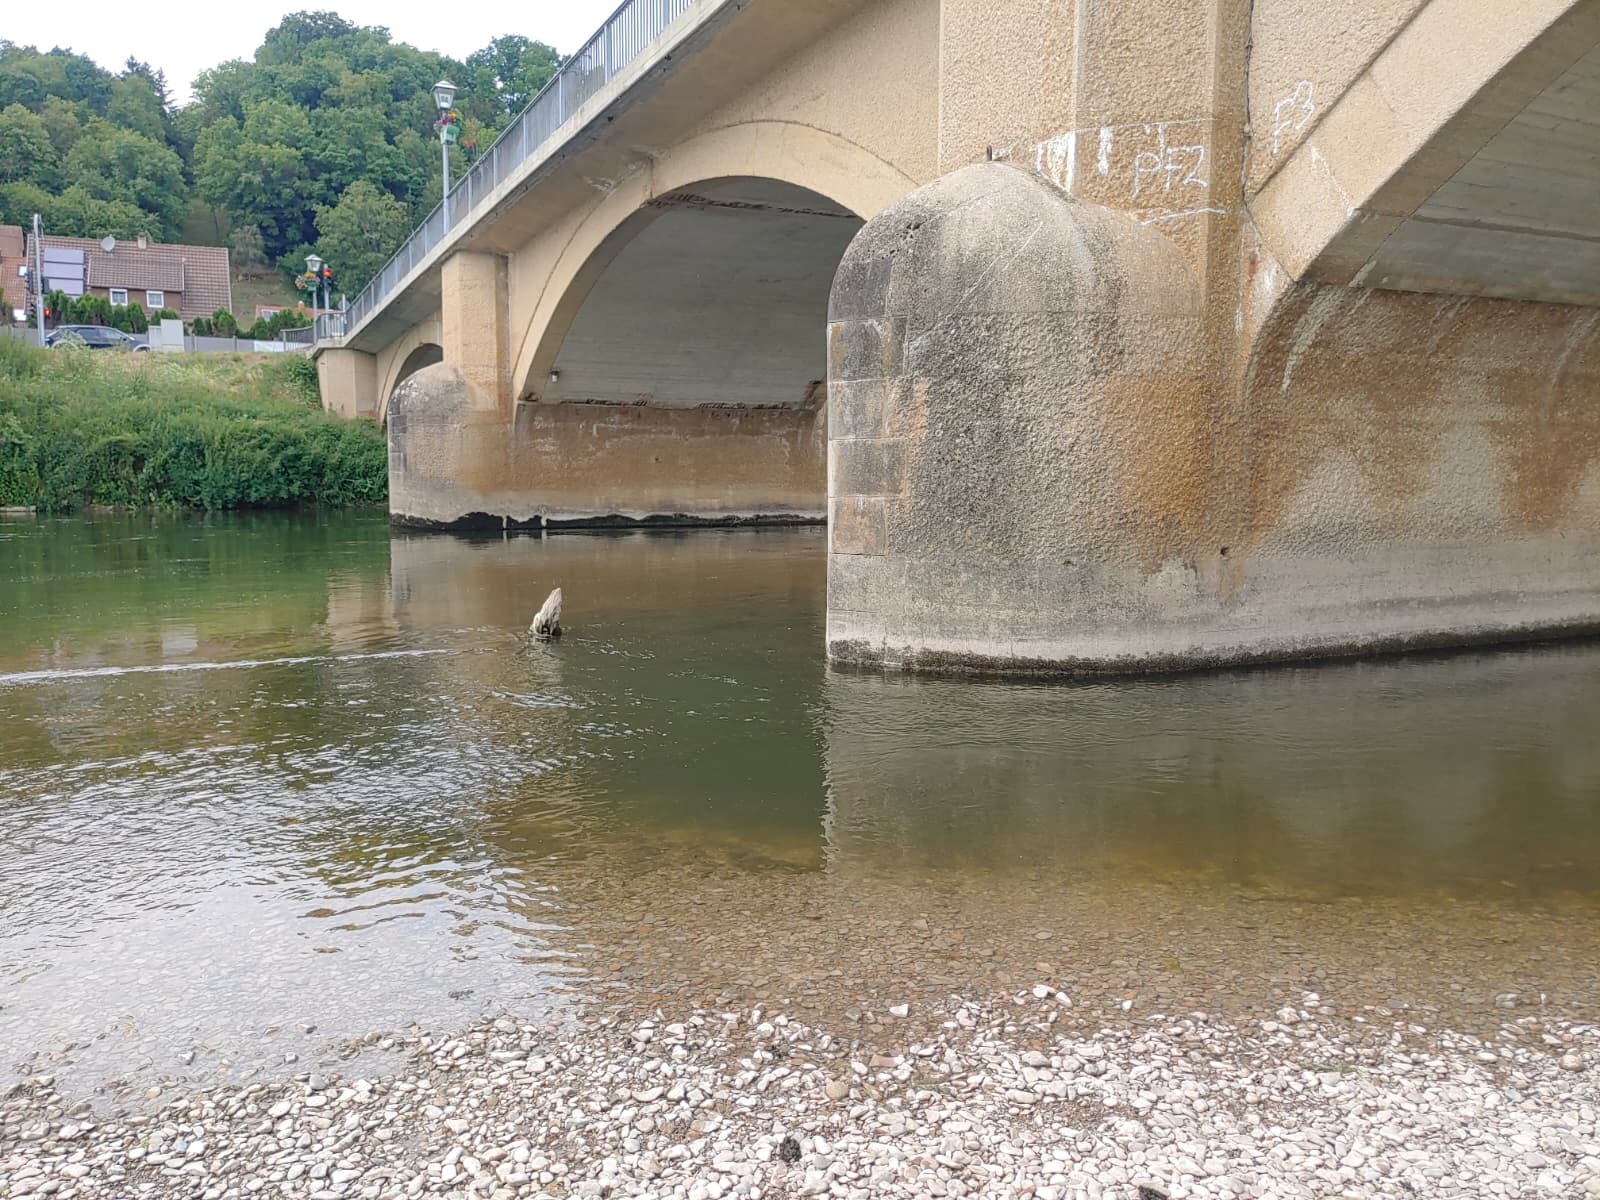
Sampling at the Neckar Bridge in Neckartenzlingen © Nina Ohlendorf
What Comes Next
The Danube campaign is still underway. Aschbach marks a milestone, not the finish line. Thousands of kilometres remain before the Danube reaches the Black Sea, along with hundreds of additional sampling locations. After the field campaign comes the next stage of scientific work: laboratory analyses, statistical evaluation, hotspot modelling, scientific publications, and EU policy briefings.
Anyone who would like to follow how water samples are transformed into a comprehensive map can explore the continuously updated results in the Global Map of Microplastics. Those who would like to support our work should know that a project of this scale does not fit within traditional funding schemes. It is made possible through donations and partnerships.
And for anyone wishing to dive deeper into the story behind the research, the full investigation can be found in "The Microplastics Case" (German: Kriminalfall Mikroplastik).
The current dataset is still only the beginning. But for the first time, that beginning can be seen on a map. And it is only possible through impact acceleration, collaboration and an unwavering commitment to taking action